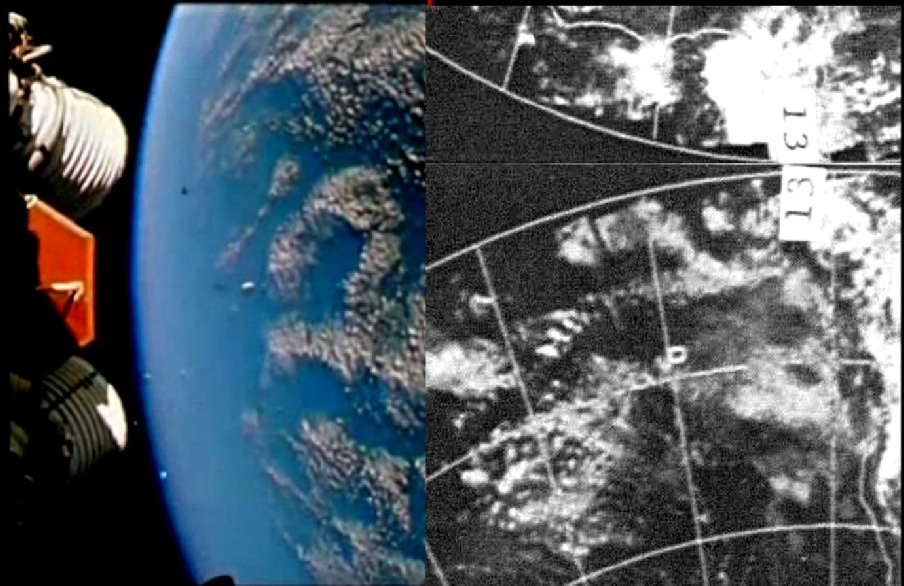
The first thing to note about the image is that the video of the separation is actually reversed, a common feature of much of the Apollo video footage. Once the image is reversed to the correct orientation, it is a quite obvious match for the satellite photograph. The coast line shown on the ESSA mosaic is that of west Africa, mostly in the southern hemisphere.
Simple enough right? Not quite.
The interstage separation footage took place at 3 minutes into the flight (see this document). The first part of the footage (at 02:30 minutes) is recorded as taking place just 45 nautical miles downrange. There is no way that weather systems off the coast of Africa would be visible from this location, and the separation itself was observed (and filmed) from the ground in Florida (see figure 4.10.2).
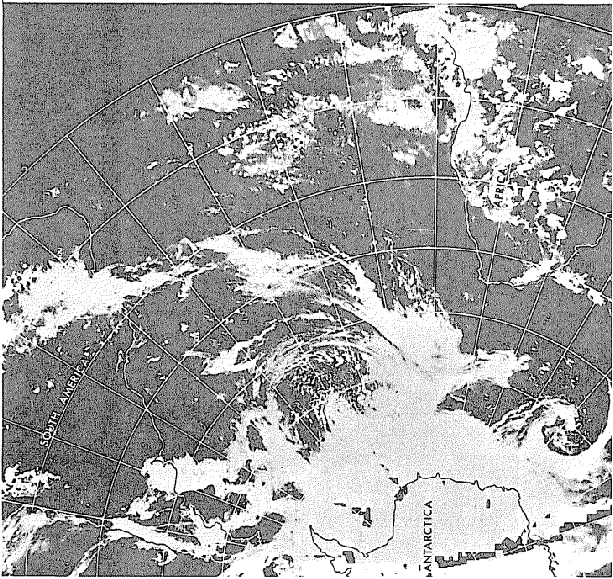
Figure 4.10.4: ESSA 3 satellite image reproduced from the Apollo 4 mission photography report. Source given in text.
The reproduction omits northern hemisphere data (some of which can be seen on some of the mission photographs), and identifies South America on the left and Africa on the right.
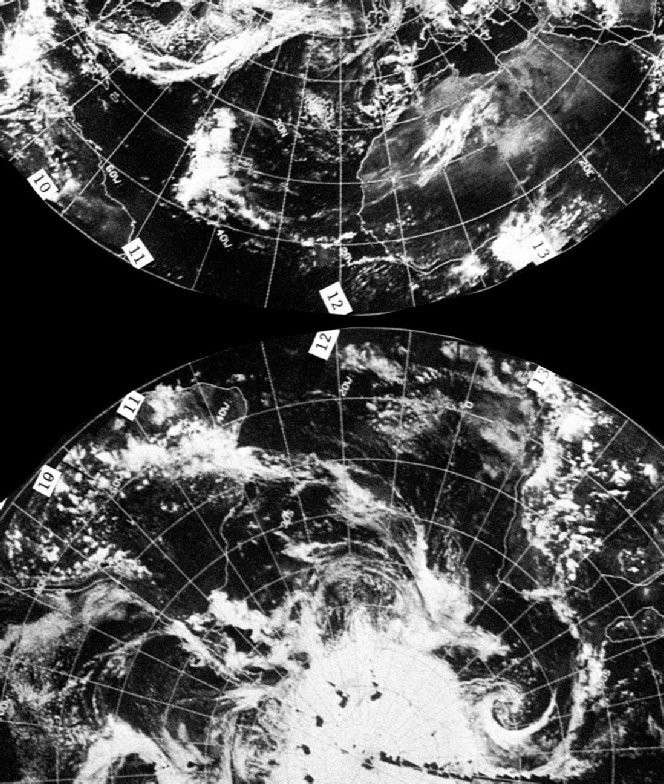
The distinctive cloud formation visible in the Apollo separation video can be made out at the top of the image in the centre, so we are clearly using the same data. A reproduction of the same data from the ESSA catalogue, including northern hemisphere data, is shown in figure 4.10.5.
Figure 4.10.5: ESSA 3 images from 09/11/67. Source given in text.
The Apollo images themselves can be found at the AIA here: Apollo Image Atlas, although the first thing to point out is that they are all upside down, with the Antarctic (where visible) shown at the top of the images. Those available at the GAP site are better quality and are correctly oriented, and these will be used in preference.
The mission report documents that apogee occurred at 17:46 (more accurately it records it as 5:46 ground elapsed time, but as the launch was noon the time is self-
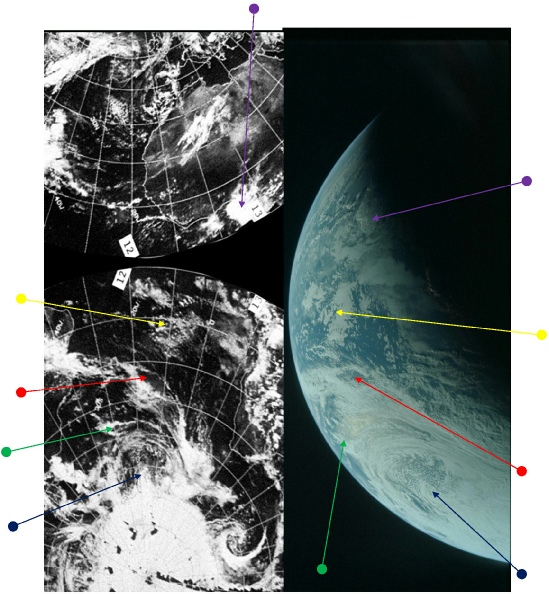
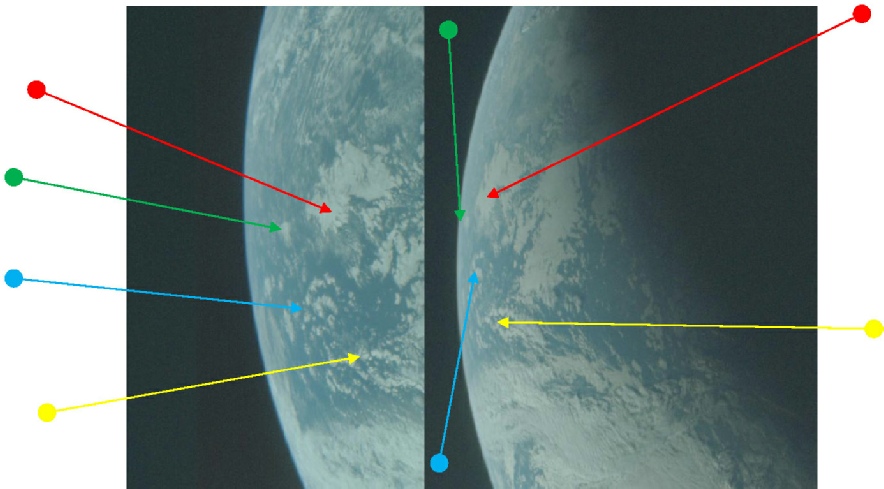
Perhaps the first task open to us is to confirm that we are looking at the correct area of Earth on the satellite image. Figure 4.10.6 below shows AS04-
Figure 4.10.6: AS04-
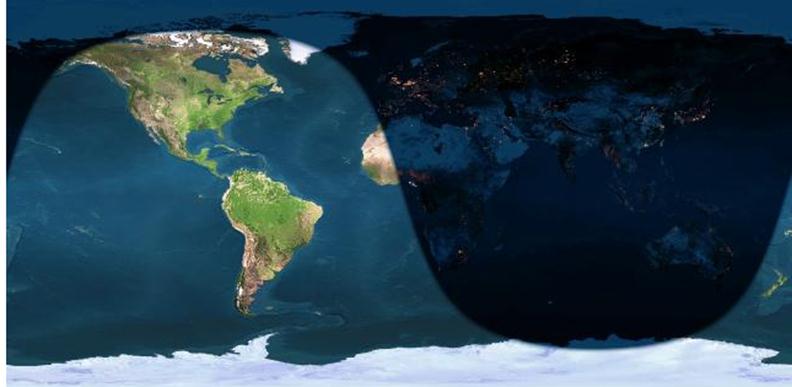
Figure 4.10.7: Projected area of daylight at 17:45 GMT on 09/11/67.
The main thing to establish here is where the location of the terminator is, and whether this matches with the terminator shown on the daylight projection. The purple arrow identifies a cloud mass south of Nigeria, a country that would be just on the terminator at the time of apogee. The terminator should follow the west African coast, and that seems to be the case in the Apollo image. Unsurprisingly, the mission record is correct!
The remaining arrows on the image serve merely to point out the location of weather systems in both images.
Another point of interest is how the length of the photography session changed the view underneath Apollo 4. According to the records, roughly 10 seconds elapsed between images, and over the course of 750 photographs this amounts to a couple of hours of orbit time. During this time, not only will the relative position of Apollo 4 have changed over the Earth, but there should also be a change in the surface visible from space thanks to the Earth’s rotation.
To see how these changes manifest themselves we can look at a number of images from the course of the photography session and see how the visible features change.
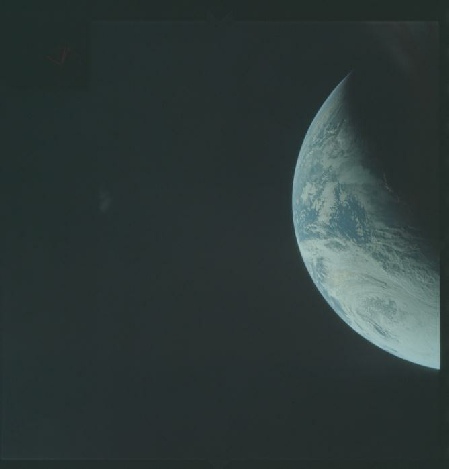
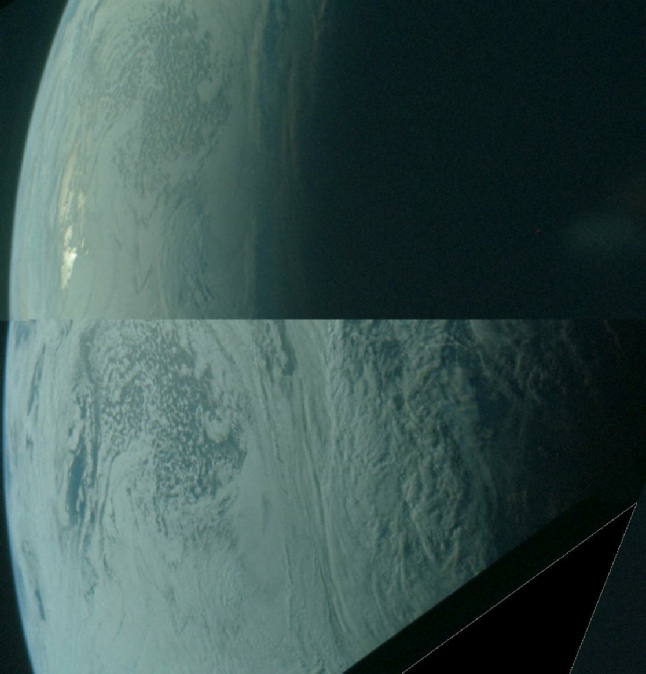
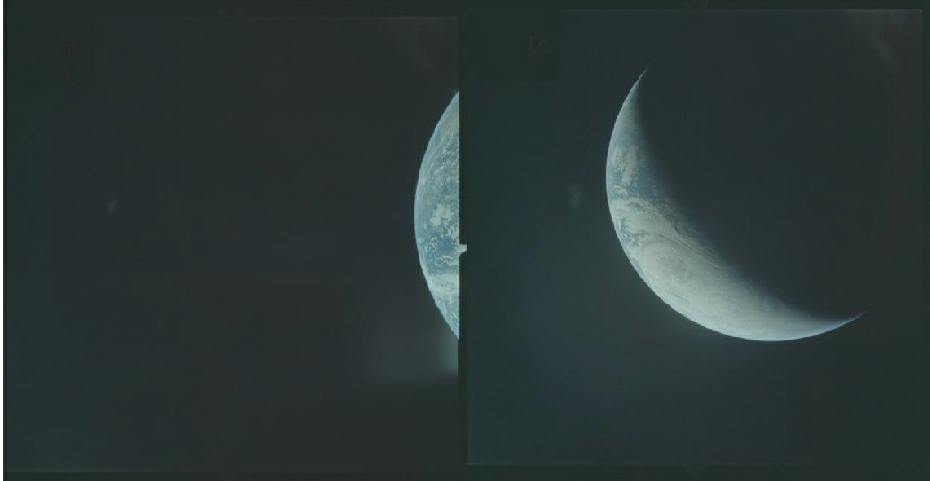
The changing position of the spacecraft is best illustrated by the apparent curvature of the terminator line. In figure 4.10.9 below, the image on the left is AS04-
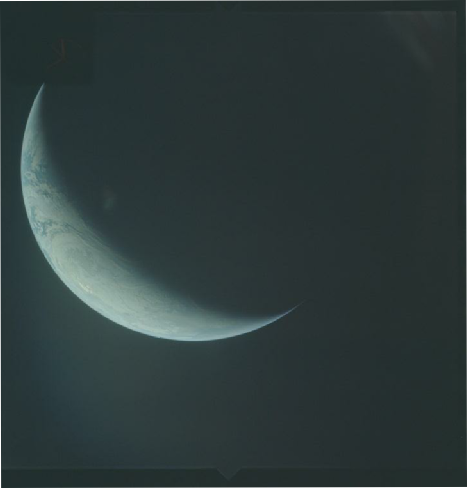
The next step is to try and assess how much of the Earth has disappeared into darkness since the start of the photography. In order to do this we need to select 2 images as far apart as possible that share the same view of the terminator. This is somewhat complicated by the first and last images in the sequence having portions missing, and the best representatives are AS04-
Figure 4.10.10: AS04-
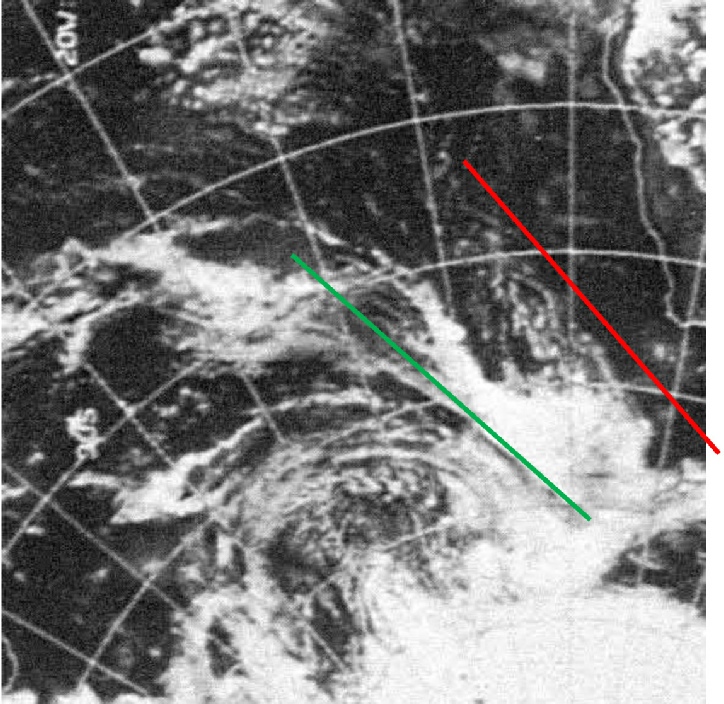
Figure 4.10.11: Region of terminator in south Atlantic in AS04-
The photographs show that terminator has moved a considerable distance across the Atlantic, and the red & green lines in figure 4.10.10 suggest that this would amount to approximately (and it is very much a rough approximation) 17-
What does seem a little counter-
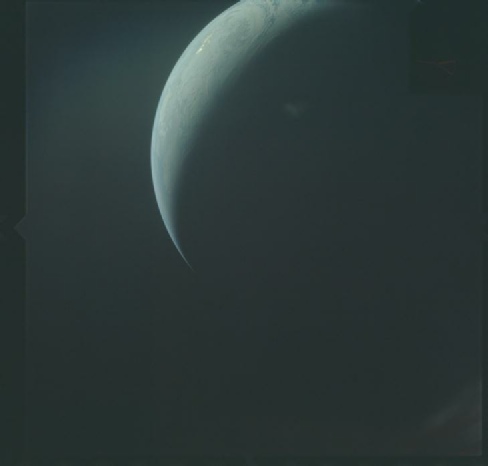
The answer is fairly obvious, and relates to the fact that Apollo 4’s orbital speed and the Earth’s rotation are evenly matched. We can see another example by looking at the cloud patterns on the western limb. In this case I have chosen AS04-
Figure 4.10.13: AS04-
What the arrows pointing to different weather systems in this image confirm is that despite over an hour’s worth of orbital movement taking place, relatively little has moved over the western limb!
On the face of things, this may present an own goal against Apollo – have we not just proved that an automated Saturn V can take off, orbit the Earth and merrily take photos of an entire globe with no human intervention? No-
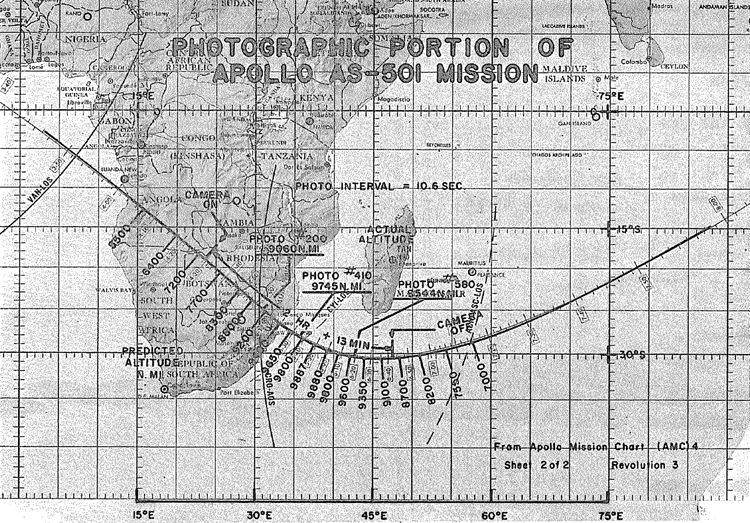
The automated process could not even guarantee that it would take photographs of the Earth – several images before apogee show nothing in shot at all, and the final images in the sequence truncate the crescent Earth. An image in the photographic report shows what the mission planners believed would be beneath Apollo 4, and while it may be an accurate representation of where the CSM actually was it clearly isn’t the area that was photographed (figure 4.10.15).
The sequence of photographs can be compiled to show the orbit as a video, and this is shown below.
The key to identifying the correct viewing angle is the circular mass of white cloud in the centre of Florida, at a guess somewhere between Cape Coral and Lake Okeechobee. Running behind this are parallel streams of cloud that can also be made out in the video still, as can streams heading eastward. The larger masses of cloud to the north also seem to be evident. So, unless proved otherwise I’ll declare the mystery (such as it was) solved -
In short, of course we can photograph the Earth remotely – that’s what the satellite photographs are, but in order to know exactly what is being photographed it’s kind of helpful to have a pair of human eyes to do it, and you still need to overcome the problem of being in orbit and the Earth moving beneath you and getting the photos home without anyone realising you were there all the time.
4.10 The Orbital Missions
No sooner is a project put to bed and you think that there is nothing more to say on a topic than someone asks a question you can’t help but answer. While the mainstay of most deniers of the Apollo landings is that any footage of weightless astronauts was filmed in LEO, and that images of Earth (despite all attempts to explain how much of the Earth is visible from LEO) were sourced in the same way, there is an even more extreme element of the conspiracy theorist camp that suggests that the orbital Apollo missions were faked.
Stupidity aside this may be down to pure stubbornness, but the orbital missions pose a problem for the hoax believers, namely that the equipment they will frequently claim was never tested was actually thoroughly tested in LEO by Apollo 7 and 9. It is therefore a logical extension to deny that they occurred, because if astronauts can perform EVAs in LEO wearing a PLSS to keep them cool, then that hardware will also work on the moon.
Having been set a challenge to identify the locations of a couple of entirely non-
This section, an unforeseen add-
Apollo 4 was a brief mission designed to provide the first workout for the Saturn V. It was launched on 09/11/67 at 12:00 GMT. It landed 8 hours and 37 minutes later, having performed three orbits of the Earth. The first two were ‘parking orbits’, after which a much more elliptical orbit was attained that gave an apogee of over 9000 miles away from the home planet. There isn’t a full mission timeline generally available on the internet, but it can be found in the mission report, along with all the technical details of the mission, here.
It was during this final elliptical orbit that a series of photographs were taken automatically, capturing the Earth below, and there is a detailed analysis of that photography here. Before looking at what that photography shows, there is another image sequence supplied by Apollo 4 that anyone who has watched a documentary of the missions will have seen several times. In addition to the Hasselblad camera in the CSM, a pair of video cameras was attached to the Saturn V to capture the separation of the first and second stages. This sequence has become almost stock footage for any Apollo related programme (including ones produced by NASA), and has often been mistakenly attributed to the Apollo 11 mission.
There are many sources for the footage, and this one is typical: YouTube. Once the first stage falls away it reveals a wide expanse of ocean, with a few fingers of cloud stretching from below the Saturn towards the middle distance, but where is it? Logic tells us that the wide expanse of ocean so soon after launch is going to be the Atlantic. Examination of the satellite image from launch day (available here) can be seen in figure 4.10.1a together with a screen grab from the Youtube footage.


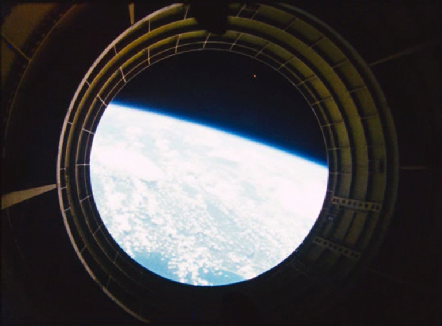
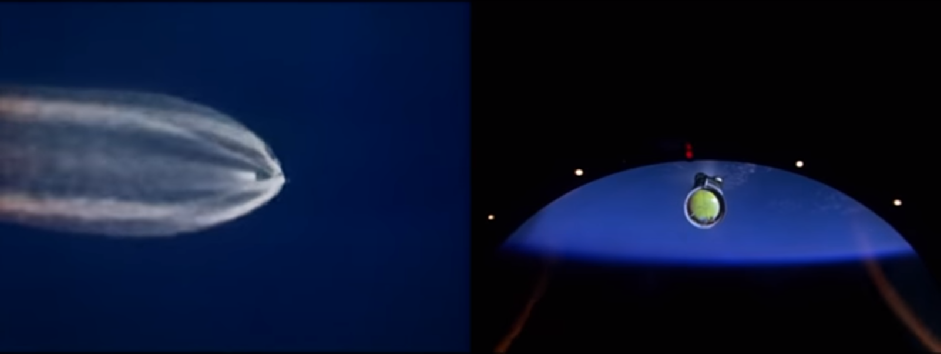
We do have a small footnote to be added here. There is a companion video to the separation sequence that is usually shown alongside the Apollo 4 footage. It shows the separation from the opposite view, with what looks like a CSM departing into the distance. The full length video shows the view as the now free floating connecting ring tumbles Earthward, and it is often also shown as stock footage for the manned Apollo missions. Figure 4.10.16 shows two of the views from it.

The origin of the footage is a matter that has been hotly debated for many years, and the technical arguments revolve around the number of ullage jets on the supposed CSM – three, as shown in the screenshot.
Based on that information, the search has been narrowed down to one of the early test missions, with most of the evidence pointing at AS-
AS-
AS-
“Two recoverable movie cameras mounted on the forward end of the first stage will record separation and ignition of the second stage”
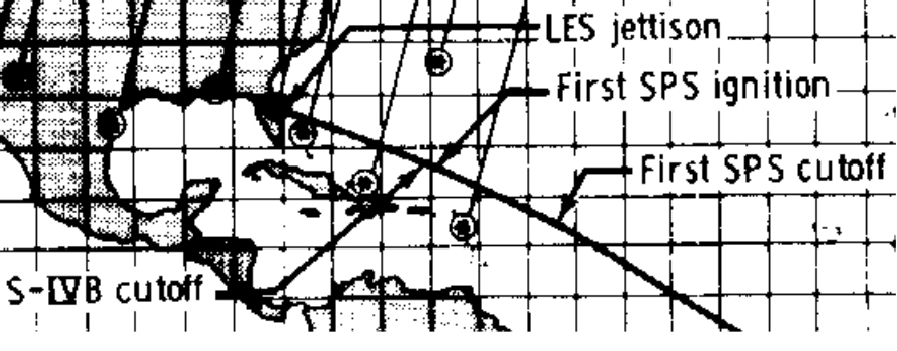
This separation was set to occur at 2 minutes 23.7 seconds into the mission, so the craft would not have travelled far from the launch pad. While the camera we are looking at appear to show the S-
The report shows that the S-
Figure 4.10.17 shows a part of the ground track diagram from the mission report. The S-
So far so good, but can we nail it down with any more certainty?
Well, fortunately we do have satellite data from that date available at the NIMBUS data rescue project. As well as the overall daily mosaics, we also have the individual tiles. These tiles are available in HDF format, which are more detailed than the .png images on the site but do require a specialised viewer to extract the image data. I used HDF-
As it appears likely that the cameras did their filming not that far from Florida, two of these tiles showing the peninsula have been joined together. This composite can then be compared with the view of Earth from the tumbling and now spent rocket stage, and a Google Earth projection of the likely view from AS-

Figure 4.10.18: NIMBUS image dated 25/08/66 at 16:35 compared with separation footage still, and Google Earth projection of the likely view. Red X marks the approximate location of separation.
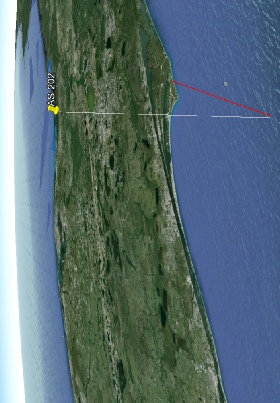
X

The document analysing the photographs from the mission is interesting in that it stresses in its conclusions that high resolution colour photography would be a useful complement to the black and white satellite images in terms of meteorological analysis, and also recommends the involvement of meteorologists in mission planning. Naturally the meteorologists looking at the photographs were keen to emphasise their importance and wanted to include more weather based photography on future missions, but this seemed to have fallen by the wayside somewhat once the moon became a serious target until Harrison Schmitt’s efforts on Apollo 17 – naturally the mission planners’ focus was elsewhere!
The report also does a more than adequate analysis of the photographs by identifying the location of the major weather systems visible and confirming their location. The focus is on using Apollo images to confirm ground and atmospheric observations rather than this document’s use of satellite data to confirm the veracity of Apollo images.
As a result there is little point in re-
The report does provide a reproduction of an ESSA satellite image and this is shown below in figure 4.10.4.
There is also quite a lot of missing cloud in the image compared with the satellite photo. Combine this with a launch azimuth of 72 degrees (effectively the heading it takes from Florida) and it therefore can’t be the cloud masses initially identified. It is far more likely to be the ones shown in off the coast in figure 4.10.3.
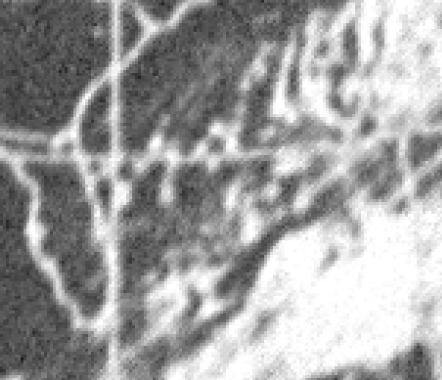
Figure 4.10.3: ESSA image from launch day showing the Florida area.
Figure 4.10.1: Saturn stage separation image compared with ESSA 3 satellite photograph
Figure 4.10.2: Interstage separation as seen from both the ground and the Saturn itself. Source.
Figure 4.10.8: AS04-
Figure 4.10.9: AS04-
Figure 4.10.12: ESSA image showing suggested terminator for AS04-
Figure 4.10.14: Comparison of western limb as viewed on AS04-
Figure 4.10.15: The photographic part of the mission as recorded by the NASA report into the images. Camera on, off and expected altitude in nautical miles are recorded
Figure 4.10.16: Screenshots from Apollo separation footage.
Figure 4.10.17: Ground trajectory of AS-