JAXA
In many ways the data from Japan’s Kaguya Selene probe are the easiest to get hold of, once you get past the language barrier and the somewhat convoluted download method, but there is so much of it that it can be difficult to know where to start. Hopefully this page will get you going and allow you to explore more.
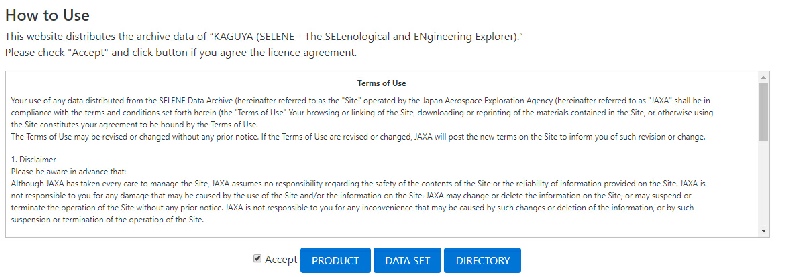
You can access the data from Japan’s lunar probe here, where you will need to tick a box agreeing to their terms and conditions before accessing anything, so you may as well do that first.
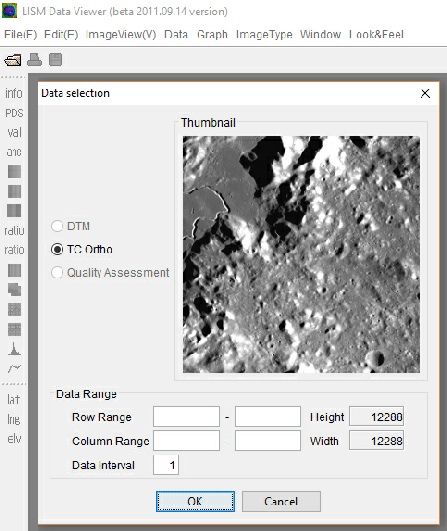
If you wanted you can type in a specific range of pixels to load, but you may as well just hit ‘OK’ to load the image.
The image will load up and you can have a pan around and see what’s there. There are other options in the software you can play with, but it’s much easier to extract the image into a more usable format and load it up in something like GIMP or Photoshop.
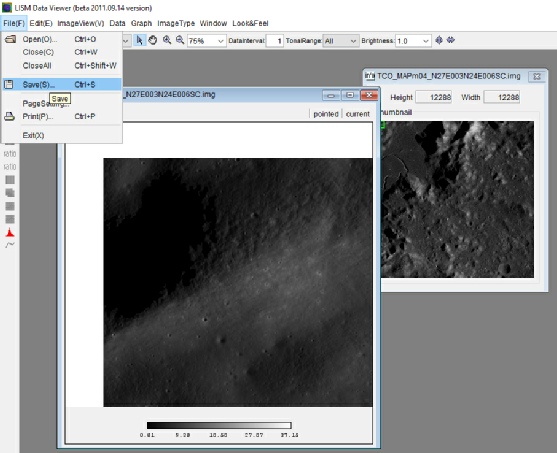
For some reason, I’ve found that if you use any other zoom level than ‘75%’ the software throws up an error so it’s best to set your zoom level to that and then go to the file menu to save the image.
You’ll only get the option to save as ‘.png’, but you can change this in your image editing software of choice.
And there you have it -
The main benefit of this method is that you can start processing the image immediately, rather than subject it to a lossy conversion process and end up working on a much lower quality image, so it’s worth a go.
Can you do any other fun things with Japan’s images? Why, yes you can!
I mentioned earlier that you can use GIS application to load the kind of image formats you get from space probes, and that you can do fun things with them. The QGIS application is free, open source, and pretty powerful. You can do immensely complicated analyses but you can also do some simple things to get nice images out of it. I am in no way pretending that I am an expert in it, or that what I am going to describe below is the definitive way of getting useful data from the JAXA (or any other) probe.
Once you’ve downloaded and installed the latest QGIS, open the shortcut for ‘QGIS Desktop with GRASS’. The easiest next step is to have split your desktop so half of it is QGIS and the other half your JAXA file. Simply drag the ‘.lbl file into the QGIS window and it will add it as a new layer.
If all you want to do is save the raw image as a jpg, or png or whatever, all you need to do next is go to the ‘Project’, ‘Save As Image’ option and choose the format you want. The nice thing here is that it will save what you can see in the project window, so if you want to save a view of a much smaller area, just use the pan and zoom tools to get to where you want and then save the image. It’s worth pointing out here that the image quality of the saved output is not as good as you get from JAXA’s own software, so if you want high levels of detail you might want to use that instead.
What else can we do? One of the uses of GIS software is to produce 3D visualisations of data, including maps and landscapes. QGIS has a couple of ways of doing this, and I’ll show you the simplest one.
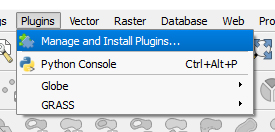
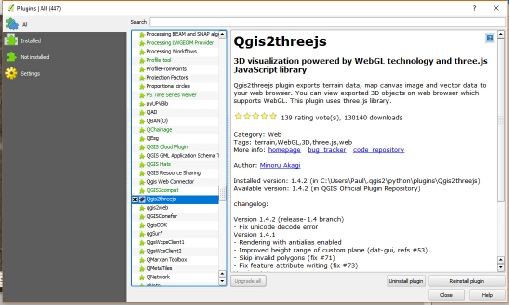
Amongst the image types you can download from JAXA are DTM and DEM models, which are digital terrain and digital elevation models respectively. You can use these to turn your 2D overhead views of the moon into 3D models by using the Qgis2threejs plugin. Make sure this is installed by heading to the Plugin menu and choosing ‘Manage and Install Plugins’ to give you this window. Scroll down to look for Qgis2gthreejs plugin. If it doesn’t have a black ‘X’ by it, click on it and hit the ‘Install’ button.
So, your next thing is to download one of the DTM models from JAXA. In this example I’m looking at Taurus-
The DTM map covers the same area and is the same filesize as the Morning Map, but in this case the file we want to drop into QGIS is the ‘.dtm’.
Having done that, I’ll run through what the 3D plugin produces to show you why you need more than one image.
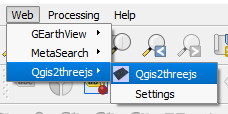
The first thing to do is to zoom in to the area you want to look at in 3D. Next, go to the ‘Web’ menu and select the plugin, which will give you the following dialog box.
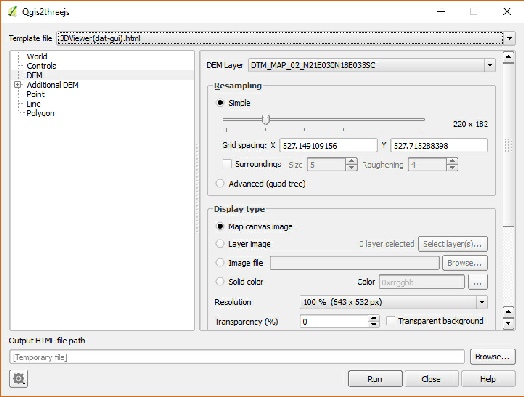
As we’re just learning here, you can leave things pretty much as they are. One thing you can look at is increasing the resolution of the output and re-
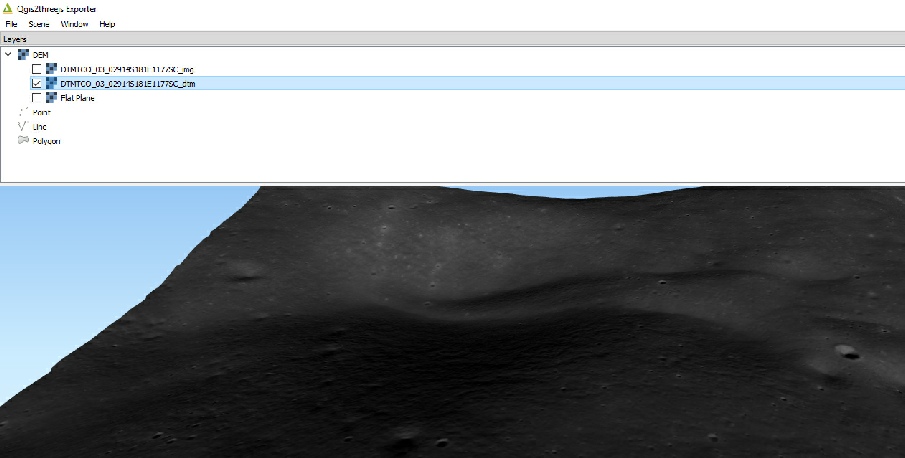
I also like to change the sky colour to black and remove the sides.
Notice that the DEM layer at the top is the file we added to QGIS.
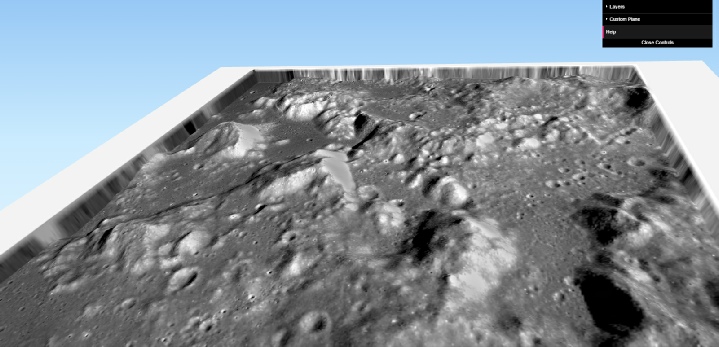
Hit ‘Run’. The plugin will process the view you had in QGIS and then open your default browser -
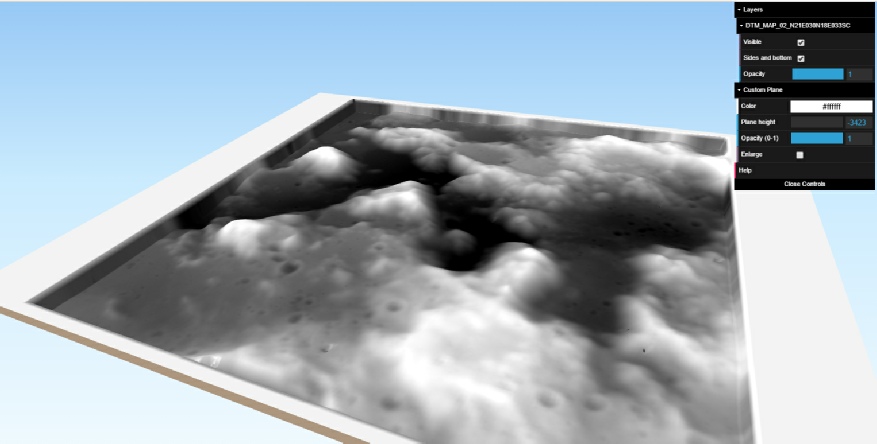
You can see from this that the resolution isn’t anything like that you can get from the Morning Map -
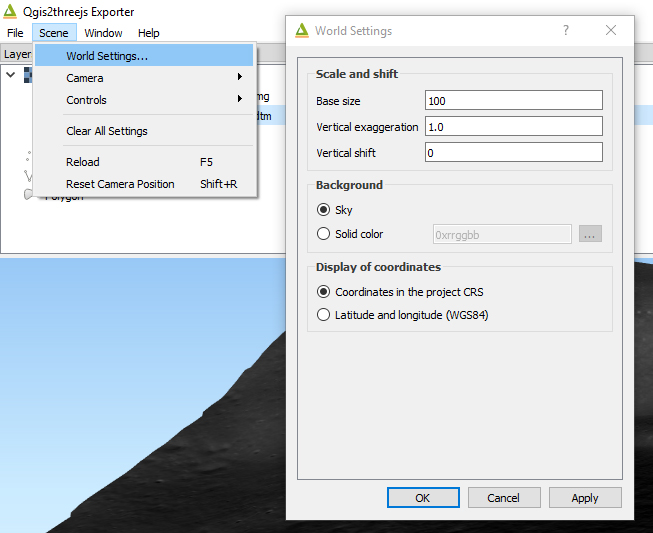
If the view seems too ‘far away’, try adjusting the ‘Vertical Shift’ value in the ‘World’ options to a higher value.
Let’s add some more information to the picture by adding the Map image.
As you’ve now added over 500Mb of data to QGIS, your processor might start to get a little hot!
OK, now go through the 3D plugin process again. Look at what’s happened to the model!
When you’ve dragged and dropped it in, make sure the Map layer is on top of the DTM layer.
Think about it -
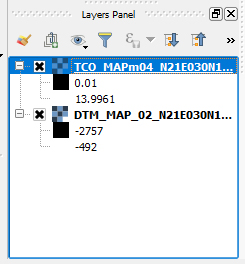
Use the ‘Layers Panel’ in the bottom left hand corner to see the order these map layers have been places]d. Drag and drop to correct them if they are the wrong way round.
How cool is that!! Have a pan and zoom around and see what it does. To save it all you need to do is to take a screenshot and paste it into your image editing software, or hit ‘Shift’ & ‘S’ to save a png file.
The best thing you can do now with the plugin is to mess around with the various settings to see what happens -
Later versions of QGIS and the 3D plugin are slightly different, and sadly offer less immediate control over the end product. They also don’t work in Chrome or older versions of IE, and you need to use Microsoft Edge or Firefox.
The process of building the map is the same, but the output involves first clicking this icon.
Clicking that will give you an output window like this.

Personally I find the colours a little too grey, so I mess around with the contrast in an image editor to make it look a little better.
Now go have fun with Japanese space data!
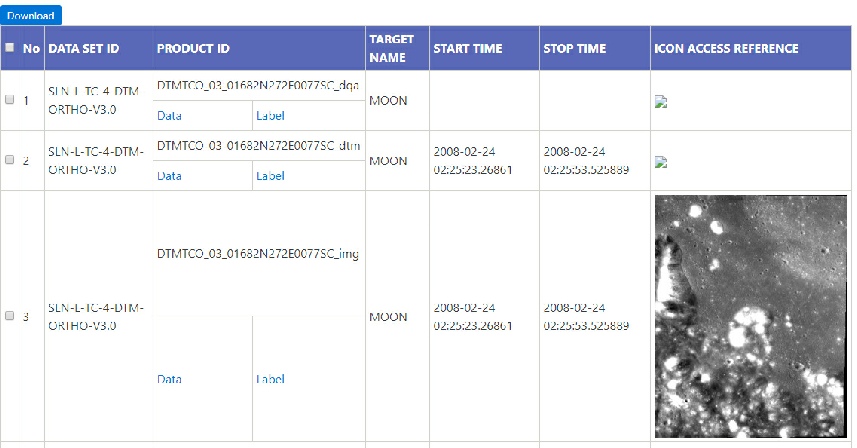
You can make life slightly simpler in QGIS by just downloading packages labelled ‘DEM_TCOrtho’, which also has a matching set of DEM and IMG images.They cover a much smaller area but the data quality is still good.
What you’ll see in the Product search window here are three files presented together for each part of the area you have selected.
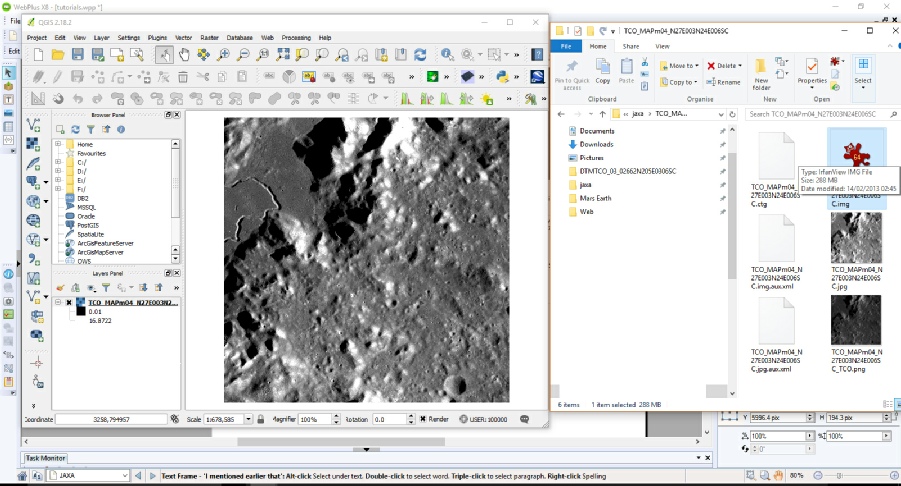
If you are fortunate enough to own a copy of Photoshop it is possible to open these files directly, but it does involve opening the .IMG file in the Kaguya viewer first to find the image size. I’ll save you the time there -
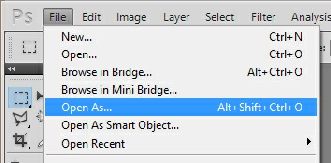
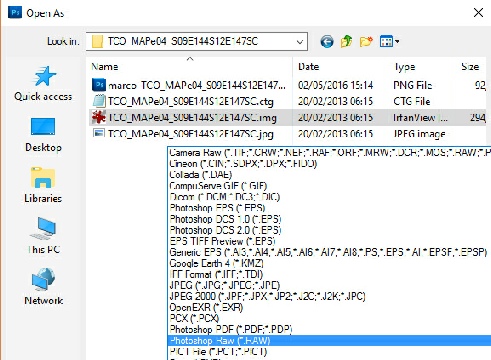
First, go to ‘File’, ‘Open As’ in Photoshop and choose ‘Photoshop RAW’ from the ‘Open As’ drop down list.
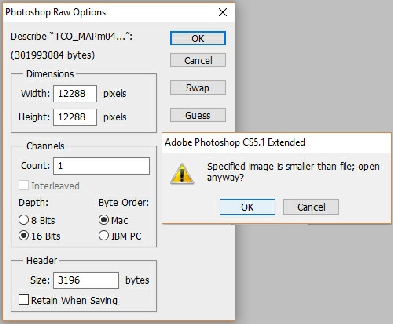
Select the ‘.IMG’ image. You’ll get another dialogue box appear. You’ll need to enter the image size and choose a bit depth of 16 Bits and a Mac byte order.
Experience tells me that the header size needs to be specified or the image will be split in an odd order. Hit the ‘Guess’ button -
If the image looks odd, close everything and try a different set of options -
When it does open the image will probable seem very dark. To fix that go to the ‘Image’ drop down and choose ‘Auto Tone’ -
 Apollo Overview
3D Overview
Apollo Overview
3D Overview
Where you go next depends on your knowledge of the dataset you want, and how much data you want.
Selecting ‘Data Set’ takes you to this menu:
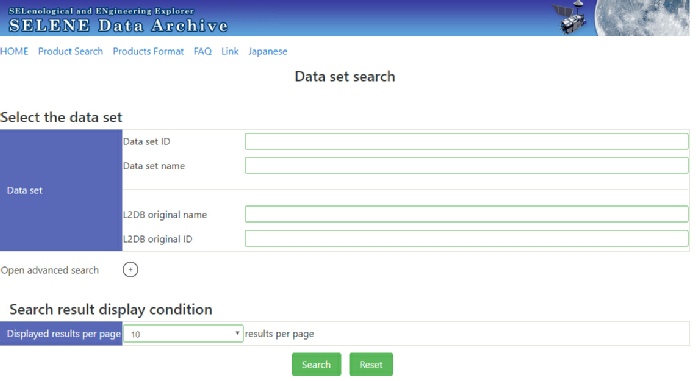
The top and bottom search boxes do the same thing, they just refer to the data sets we’re interested in using different names. The most useful ones in the drop down lists in terms of getting pretty pictures of the moon are (Top menu/Bottom menu):
-
-
-
-
The latter two are more useful for GIS plotting of the data, which we’ll deal with later.
If you choose an option but want to change your mind you’ll need to either clear the choice boxes or refresh the page as it only shows the one you’ve chosen.
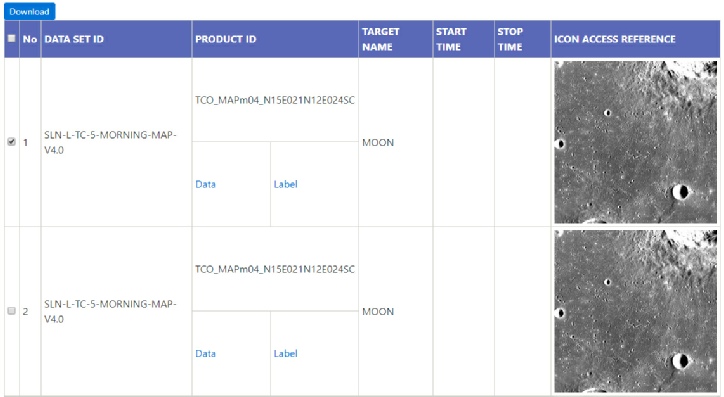
Once you’ve picked your desired image type hit ‘Search’ and you’ll see something like this at the bottom of the page:
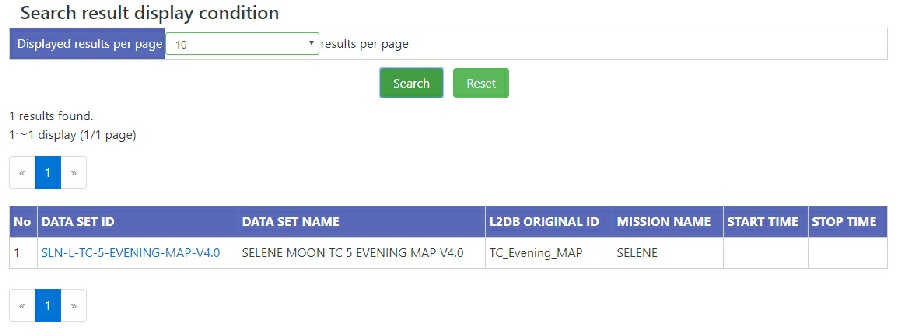
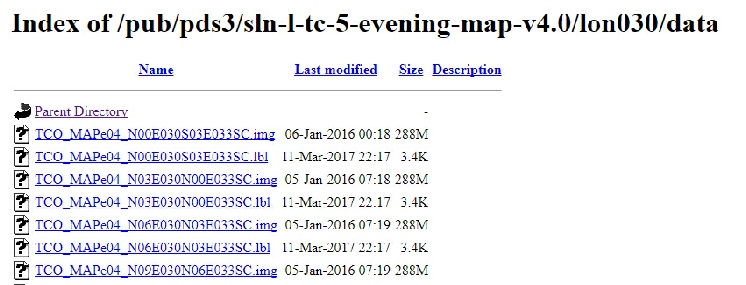
Clicking on the Data Set ID takes you to the view below left, where each folder equates to a line of longitude on the moon’s surface. Clicking in one of those folders takes you to the view shown below right:
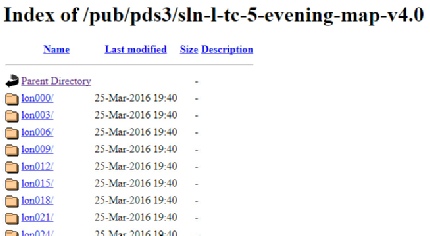
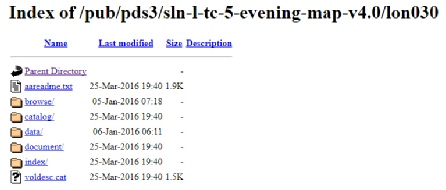
The folder we are really interested in here is the ‘data’ one, and inside that you’ll see a list of every image that has been created along that line of longitude. The images are in pairs, a ‘.img’ and a ‘.lbl’ file. It’s worth downloading both as the .lbl file is useful in other software.
If you are trying to download the DTM Ortho type, each image has 6 components -
The other (and perhaps more useful) way to get the images you want is to choose the ‘Product’ option. Clicking this takes you to exactly the same sort of drop down list menu choice as before, but with the ability to select your area of interest on a map:
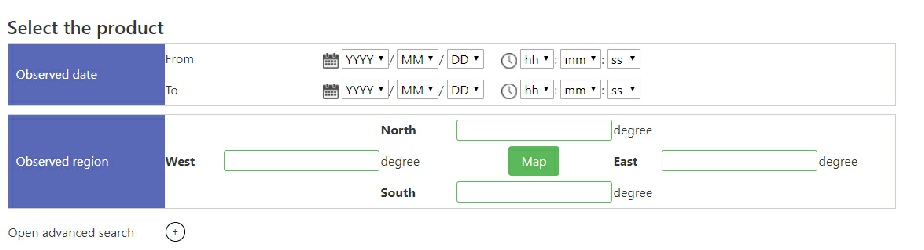
Clicking the ‘Map’ button takes you to this screen (below left), where you can draw a square in the your region of interest.
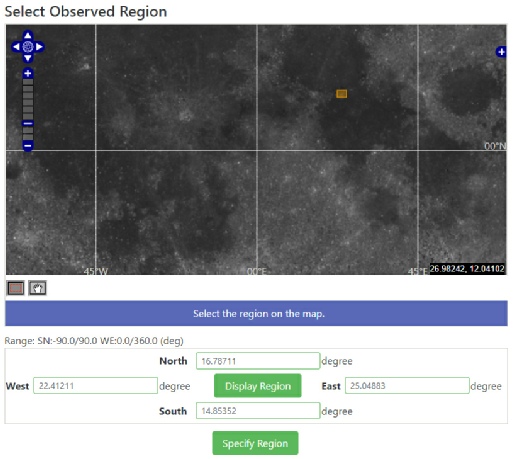
One thing I’ve found is that the map does not zoom in far before producing an error, something that may be related to the version of java I have. Specifying too large an area will give you lots of potential results, so you may need to enter in a range of coordinates manually if the map disappears for you as well. If you’ve done it that way confirm your search area by clicking the ‘Display region’. Hitting ‘Specify region’ will then take you back to the search page, where you can (unsurprisingly) hit ‘Search’.
You should then see a list of results:
To get the image you want, right click on the ‘data’ and ‘label’ links and choose ‘save link as’ or ‘save target as’ (depending on your browser). The ‘label’ files are useful in GIS applications discussed later.
Once you have them you can then process them in the same way as the other download method. Note that it is possible to select multiple file sets and then click ‘download’. All this does is give you a text file with links to all the files you’ve selected, which is useful if you have lots of files you want and a download manager, but otherwise pretty pointless.
So, now you have files you want you need to know how to process them. The important file there is the ‘.img’ file, and this is where we need to start using some specialist software. If you’re a GIS user, you can import this into your software of choice (such as QGIS), and we’ll look at that in a while, but for now we’ll use JAXA’s own software which you can download here. It’s a standalone file, which means you don’t need to install anything, just save it somewhere you can find it and run it from there.
When you do run it, go to the ‘File Menu’, select ‘Open’ and browse to the ‘.img’ file you extracted earlier.
You’ll see a window like this.
All the files will have the same name, just a different extension. Download the DTM and IMG files, and drag those into QGIS as you did with the other versions. The beauty of looking for these files is that both layers that you need for 3D are together, rather than having to do two separate searches.
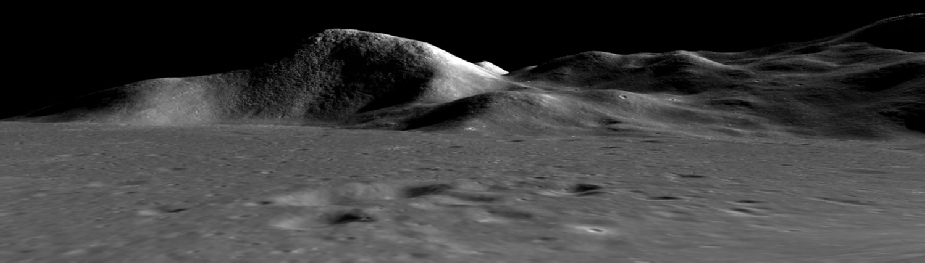
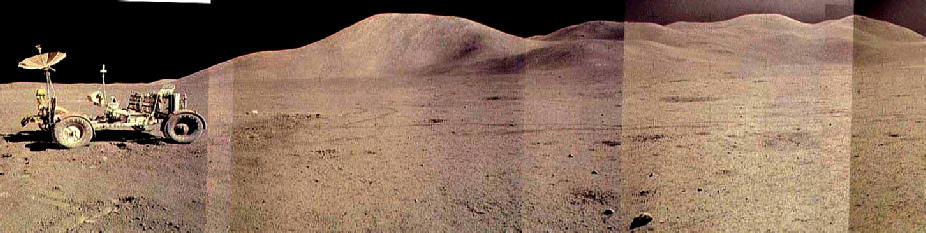
Here, for example, is one I did from Apollo 15’s landing site (top), compared with an Apollo panorama taken on the ground (bottom).

You pan and zoom around this model in the same way as before.
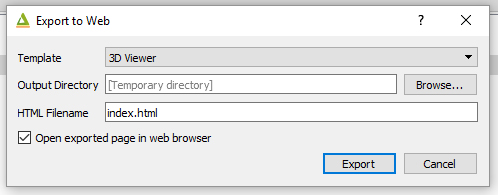
Exporting to an image is done through the ‘File’ menu (below left), as is exporting it to a standalone web page (below right).
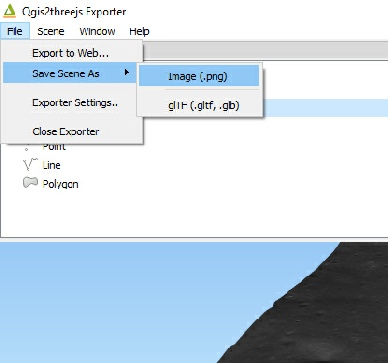
Changes to the look of the model are done under the ‘Scene’ menu.
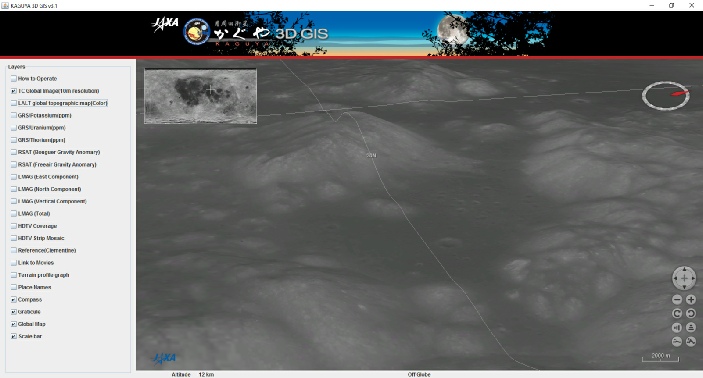
One final thing that’s available to use from Japan’s lunar data is the 3DGIS tool, which works a little like Google Moon.
You can get it here, and it runs on java -
Once the software is running, you can use the tools in the bottom left corner to rotate the view, turn it from a top down view to a more 3D version, and also exaggerate the elevations to make mountains look more dramatic. The left hand side shows you what other map layers are available.
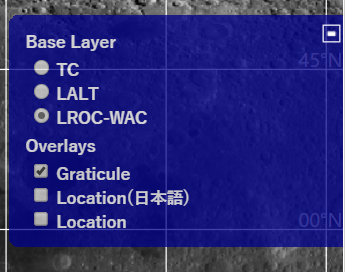
It’s worth pointing out that the JAXA map doesn’t zoom in very far before it disappears, so it’s worth clicking on the ‘+’ sign in the top right. This produces the menu below.
Choose the ‘LROC-
The ‘Location’ option will give you place names.