Back to Index
ESSA Satellites
2.4 - Modern imagery
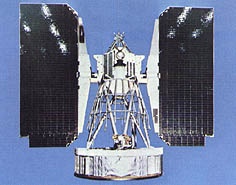
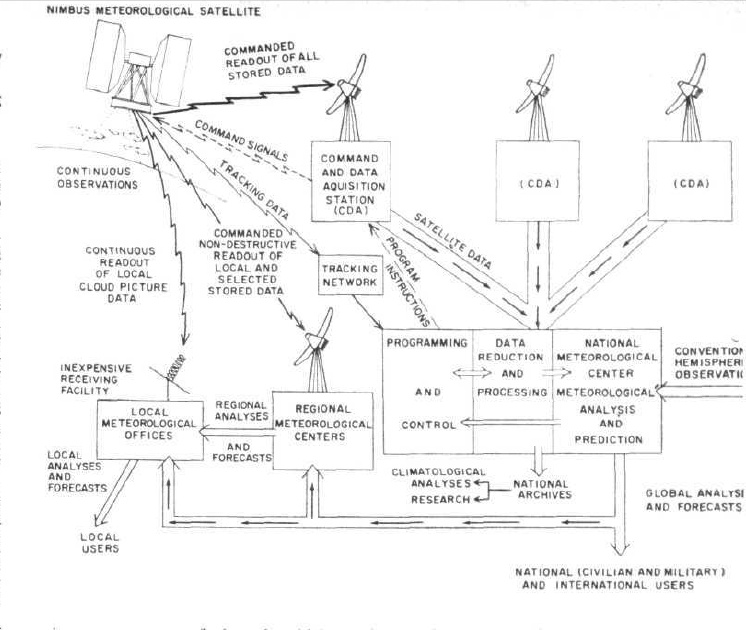
Figure 2.3.2. Schematic diagram of NIMBUS satellite data transfer (Source)
As indicated in the diagram, NIMBUS images were available to anyone with a suitable decoder, and the NASA web page here: NASA source reports the uses to which European meteorological agencies put the data. As with ESSA data, amateurs could also gain access to the images. This photograph from the Baltimore Sun of May 13 1968 shows a Scottish amateur meteorologist’s set up, and the image he has received can be seen on the cylinder (figure 2.3.3). It’s worth comparing that with the ‘official set up of an APT receiver in figure 2.3.4.
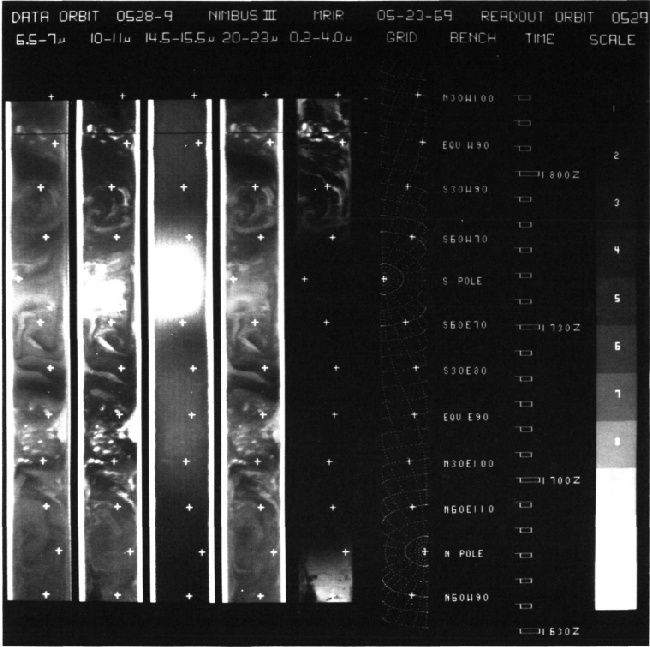
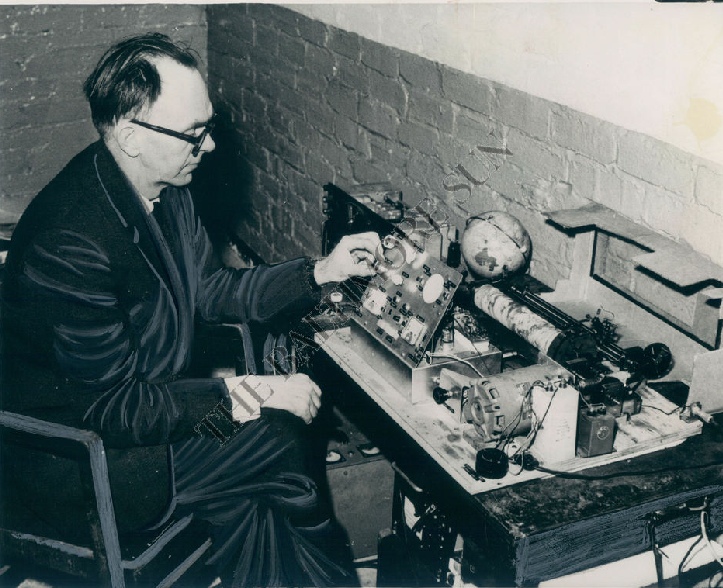
Figure 2.3.3: Baltimore Sun image from 13/05/68 showing Scottish amateur meteorologist John B Turke’s set up for receiving NIMBUS-2 images. Original image from eBay, copyright Baltimore Sun.
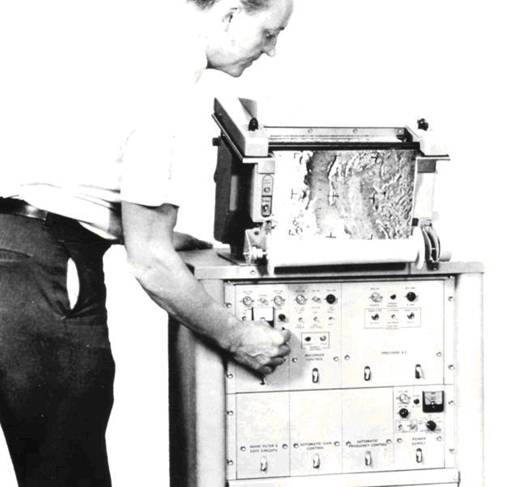
Figure 2.3.1: A Nimbus Satellite (Source)
At the same time as the ESSA program of active meteorological satellites, NIMBUS satellites Figure 2.3.1) were being launched as research and development tools to test out new atmospheric sensing techniques, and pioneered the AVCS & ATP techniques used in ESSA satellites. They had a secondary mission of providing useful meteorological data.
Like ESSA, they were polar orbital geosynchronous craft, and over the time of Apollo there were 3 satellites in operation. They orbited slightly lower than ESSA craft at around 700 miles, and orbits were completed in less than two hours. While ESSA used 2 cameras, NIMBUS satellites had 3, one pointing straight down and the other 2 at 35 degree angles at either side, so that despite a low orbital altitude, considerable ground coverage could be achieved (over 800000 square miles per frame). Each line of AVCS imaging equated to roughly 0.6 miles. A complete image took 6 seconds to take and successive images were taken 90 seconds apart (NASA source).
In parallel with the AVCS system, APT was also used. On NIMBUS, the APT images covered roughly 1600000 square miles, with each line of image scan representing roughly 1.5 miles. Each image was stored electrically on a plate and readings from the plate were transmitted to Earth, and the image cycle took just under 4 minutes to complete.
Figure 2.3.2 illustrates how the NIMBUS satellites were intended to operate in terms of data reception and transmission, collection and distribution.
The VHF signals sent by the satellite were received by the same type of dipolar antennae as ESSA transmissions, and were processed in the same way as ESSA signals.
Figure 2.3.5 shows a single orbital track's transmission from 24/05/69 (during Apollo 10).
Figure 2.3.4: APT receiving equipment. Source (left). Source (right).
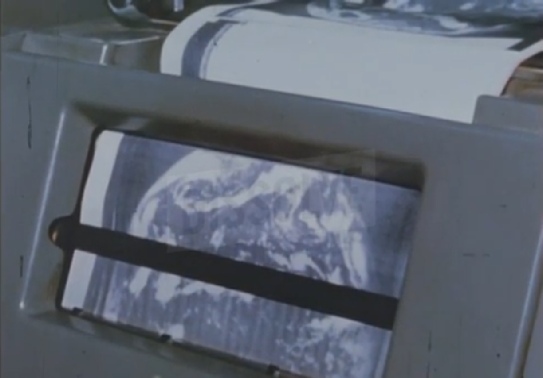
Figure 2.3.5 – A single orbital pass transmission from NIMBUS 3 (NIMBUS 3 Source)