4.11 -
As an evolving project, this researcher has always been keen to look for new sources of data that support the idea that satellite meteorology provides conclusive proof that the pictures of Earth taken by Apollo are absolutely genuine. One such proof emerged with the discovery of a book compiling satellite images as part of the BOMEX study, a book of which I now own a copy. The fact that I own this means I can use photographs of the page, rather than rely on other people’s scans.
BOMEX (Barbados Oceanographic and Meteorological Experiment) was a research project looking at the interaction between the Ocean and Climate in the Caribbean, as detailed here. It ran between May 1st and July 28th 1969, and thus covered the Apollo 10 and 11 missions. Some data from this research was found when looking into Apollo 11 (see here), but recently a more detailed collection of satellite images from the ATS-
It also presents ESSA images in the original format, rather than the circular projection used for much of this research and these were used by BOMEX when ATS had a transmitter problem. Additional studies of the ESSA and ATS images can also be found here, here and here and and are included where possible. ATS images were also produced for this conference paper in 1972. We’ll also include NIMBUS-
The time sequence of photographs allows us to pick the image that matches most closely the times that we have estimated for selected Apollo images to see how they compare.
Rather than overcomplicate the existing structure, and to avoid having to do a lot of renumbering of figures, I’ve added this as a new section.
So, let’s start with Apollo 10.
4.11.1 -
The BOMEX study was focused on the Caribbean, which means that the first image available to us from Apollo that is any use is actually from May 23rd -
Observations given here suggest a time for the photograph of around 18:45, based on the terminator position and the weather data available in other satellite images. We also have this from the mission transcripts:
122:05:53 Stafford (onboard): Hit it, quick. Go, baby, go.
122:05:56 Young (onboard): What?
122:05:57 Stafford (onboard): The Earth. Hit it. Again, baby…
Followed by some suggestions about with camera settings would work. This converts to a time of 18:54 on the 23rd.
The BOMEX document has 3 close up images from that date, taken at 11:41, 16:04, and 17:54 GMT, so we have one taken within an hour of the Apollo image. As Earth’s climate is a dynamic and evolving thing, a photograph taken 7 hours before the Apollo one is likely to contain a broad similarity to it, but the finer details should be different.
Let’s see how that works out by looking at figure 4.11.1.
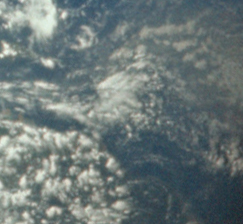
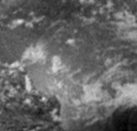
The square on the ATS photographs represent the location of ocean going research vessels. At the bottom of each image is the coast of northern South America. The details in the Apollo image are slightly affected by the difference in viewing angle.
So -
The next available shot of the Caribbean was taken on May 24th, and is covered by an ESSA-
Figure 4.11.1.2: Earth section of AS10-
The estimated time here for the Apollo image is 18:45, which compares well with the 16:32 time for the ESSA-
The next ESSA-
The Apollo picture is estimated here to have been taken at 18:00, compared with an ESSA time of 17:29, and the correspondence is obvious enough not to need illustrating with arrows. Amazingly, the closer the satellite image time to that of the Apollo image, the greater the degree of correspondence between them.
That’s all we can do for Apollo 10, time to look at Apollo 11.
4.11.2 -
The first photographs we can look at for Apollo 11 were all taken within a short time span on the way out towards the moon. As discussed here, AS11-
The BOMEX document supplies additional 2 additional images from ATS taken at 11:15 and 20:17, so we have one image taken almost at the same time.
Before we look at those, let’s see how Caribbean weather patterns develop in the three Apollo images in figure 4.11.2.1.
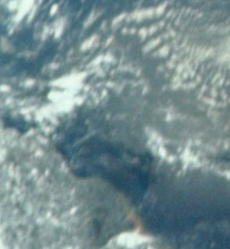
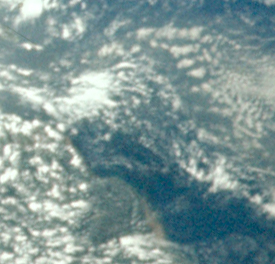
Figure 4.11.2.2b: The Caribbean area in AS11-
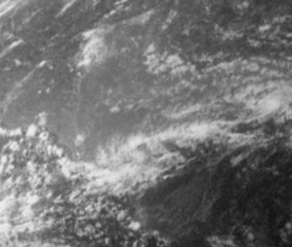
The first thing to point out is that the three images are not identical. The broad patterns of weather are the same, but there are notable subtle differences between them, particularly in the movement of the horizontal strips of cloud in the top right, and the development of the clouds over the South American landmass bottom left.
We know that the closest image to any of the ATS ones is the one on the right, taken at almost the same time, so how does the Apollo image compare with the satellite ones? Let’s compare them in figure 4.11.2.3.
Figure 4.11.2.3: ATS-
It’s obvious really, and it shouldn’t have to be pointed out, but the ATS photographs very clearly show that the nearer you get in time to the Apollo photograph the closer the degree of correspondence. As you would expect, the last one in the ATS sequence (bottom left), while it has suffered from the fading light as the region nears the terminator, shows an exact correspondence with the Apollo photograph taken at the same time. The NIMBUS image does not quite cover the same area, and was taken at 15:38 and is a match for the earlier ATS images but less so for Apollo. ESSA’s view at 18:18 is an extremely good match for the Apollo photograph taken at 18:30, and still pretty good for the later view.
Another ESSA image (taken from this report) shows a different part of the Apollo image (figure 4.11.2.4).

As before, the development of weather systems is very obvious from the sequence of ATS photographs, and as before the closer in time the ATS image is to the Apollo one, the greater the degree of correspondence between them.
As well as BOMEX collecting satellite data, it also collected photographs taken from the ground. One example of that can be found in this report, which shows advancing cumulus clouds viewed south from Barbados. Barbados’ location, and the photographs themselves, are shown in figure 4.11.2.6.
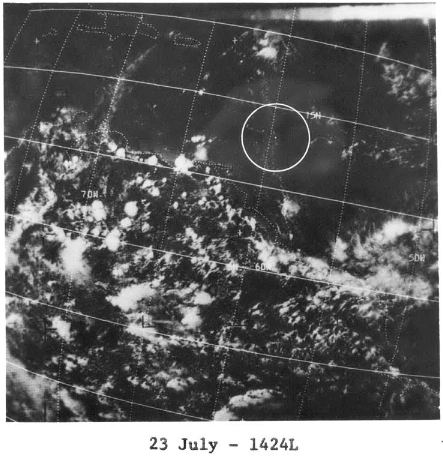
Despite the fact that the Apollo image was taken nearly 3 hours after the last ATS one, it bears much more resemblance to that satellite photograph than the one taken 6 hours earlier. Most notable is the separation of the long cloud mass running along the bottom of the image into several distinct masses, a developmental process that is seen to be complete in the final (Apollo) photograph in the temporal sequence.
A similar theme can be seen in the final image available to us showing the BOMEX study area, AS11-
As before, the Apollo image can be seen as part of a logical developmental sequence showing weather patterns evolving over time, and it bears much more similarity with the image taken a couple of hours before it compared with the one taken several hours before it.
What we have managed to do here, using actual original source material, is provide more evidence that the unique meteorological fingerprint represented by the Apollo images are indeed time and date specific and that the Apollo images are part of a temporal sequence showing the continuous evolution of weather systems -
It also shows that the data supporting Apollo are, and have always been, publicly available to anyone who cares to look, and if you want you can even buy the books (figure 4.11.2.9).

Figure 4.11.2.9: My copy of the BOMEX book!
Figure 4.11.1.1: Top row: full ATS-
Left is a NIMBUS-


Figure 4.11.1.3: AS10-


Figure 4.11.2.5: Top row: ATS-
Remainder: ATS-


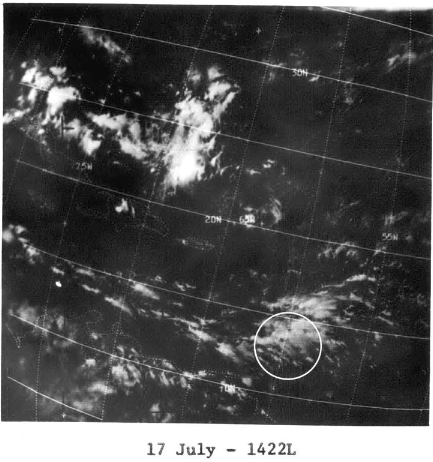
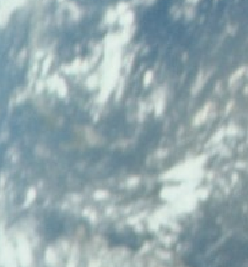
Figure 4.11.2.4: Section of AS11-
Although taken earlier, there is still an excellent match with Apollo’s earliest view.
The next sequence of ATS-
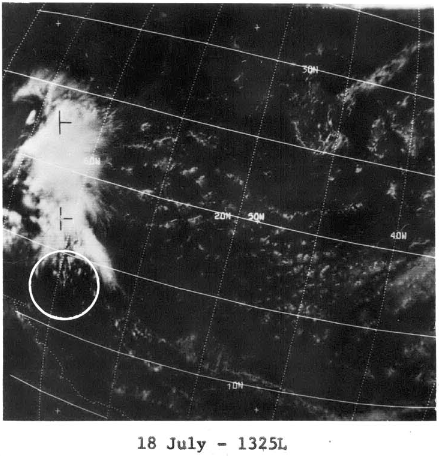
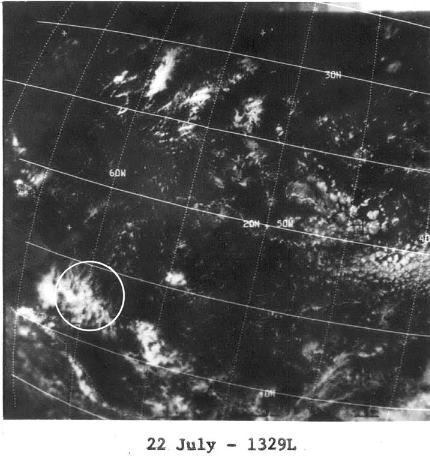
Figure 4.11.27: Top row: ATS-
Second 2 rows: ATS images taken at 11:35 (top left) and 16:10 (top right), at 14:54 centre left) compared with AS11-
Bottom row: Essa image (left) and a detail of the ATS view right).
The Apollo images have been perspective corrected.
The ground based images were taken around an hour before the ATS view (10:07 -
Most of the Apollo images taken during the landing itself show the Pacific, so sadly we don’t get the opportunity to repeat this exercise for images taken at the moon itself. The only two that do show the relevant area of the Caribbean are either too out of focus (AS11-
The next clear image of the region was taken on the way home. There are three ATS images from two different sources, and the view of the Caribbean is very clear and worth examining. Figure 4.11.2.7 shows the ATS images together with AS11-
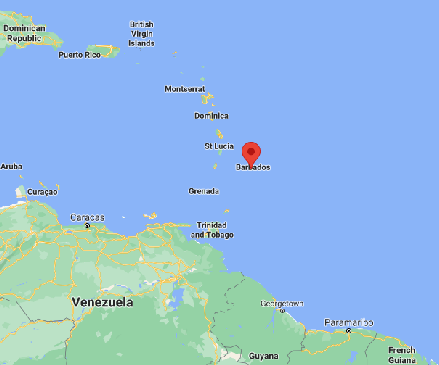
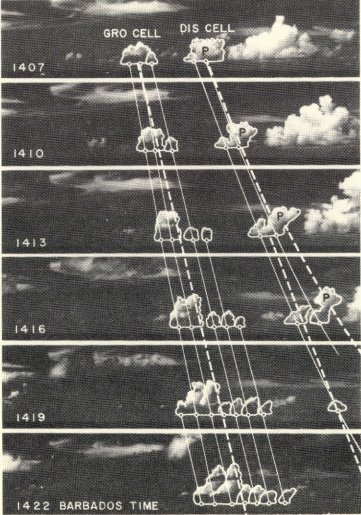

Figure 4.11.2.6: Map showing the location of Barbados, cumulus images photographed viewed south of Barbados, and close up of the ATS satellite view of that area.
Figure 4.11.2.8: Top row: ATS-
Next 2 rows: ATS-
Bottom row: NIMBUS-
The Apollo image has been perspective corrected.


Figure 4.11.2.1a: ATS-


