4.7.M -Meteorological data
The preceding sections have already identified several tropical storms and hurricanes that existed during this mission, and these storms were reported in contemporary journals. As with other missions, synoptic charts are available from a few sources, but they are only of any real use for the first half of the mission when there was a sufficient amount of the Earth's surface in view to allow meaningful comparison. The northern hemisphere is also not viewable in many of the Apollo photographs.
The usual synoptic chart sources (German , South African and NOAA) have been selected again here, as they are consistently available. See preceding sections for sources.
The first day of the mission is a good starting point here, as north America is visible, and we have two images taken within a few hours of each other to get good coverage of a considerable amount of the globe.
Figure 4.7.M.1 shows the NOAA and German synoptic charts for the 26th in comparison with the two Apollo images from that day: AS15-91-12342 and AS15-91-12344.
The weather system crossing the Atlantic (yellow arrow) is clear on the German synoptic chart, as is the one over north America. The purple arrowed system marks the line of disturbed cloud along the ITCZ. As with other missions, there is good correspondence between the synoptic and photographic data.
The next synoptic charts to be examined are from the 28th of July, which was analysed in figure 4.7.13 using AS15-91-12350. The synoptic charts for this date are shown, together with a reproduction of the Apollo image, in figure 4.7.M.2
The ITCZ is just visible on the Apollo image, but the other main weather systems, themselves a development of the ones seen in the previous image, are still visible and easily identifiable.
The final synoptic image is from the South African data covering July 31st. This allows us to compensate for the tilt of the Earth relative to the lunar based observers. Africa was covered in figure 4.7.18 using Apollo image AS15-91-12404. Figure 4.7.M.3 shows the resulting analysis.
As is obvious from the figure above, there is only one feature visible, and that is the front off the south African coast manifesting itself in the curl of cloud in the Apollo image.
4.7.4 Conclusion
It will come as no surprise to anyone that the photographs of Earth taken by Apollo presented here can be demonstrated to match with satellite derived weather patterns. Most images are easy to place, and it is a relatively simple task to derive a time for the photograph purely from the satellite data and then verify this by using secondary data. In other cases the secondary data assist in identifying the time of the photograph. The photographic evidence is backed up by meteorological evidence, not least the presence of a hurricane.
It all points to the conclusion that Apollo 15 went to the Moon and returned safely, just like the missions before it, and just like the next mission, Apollo 16.
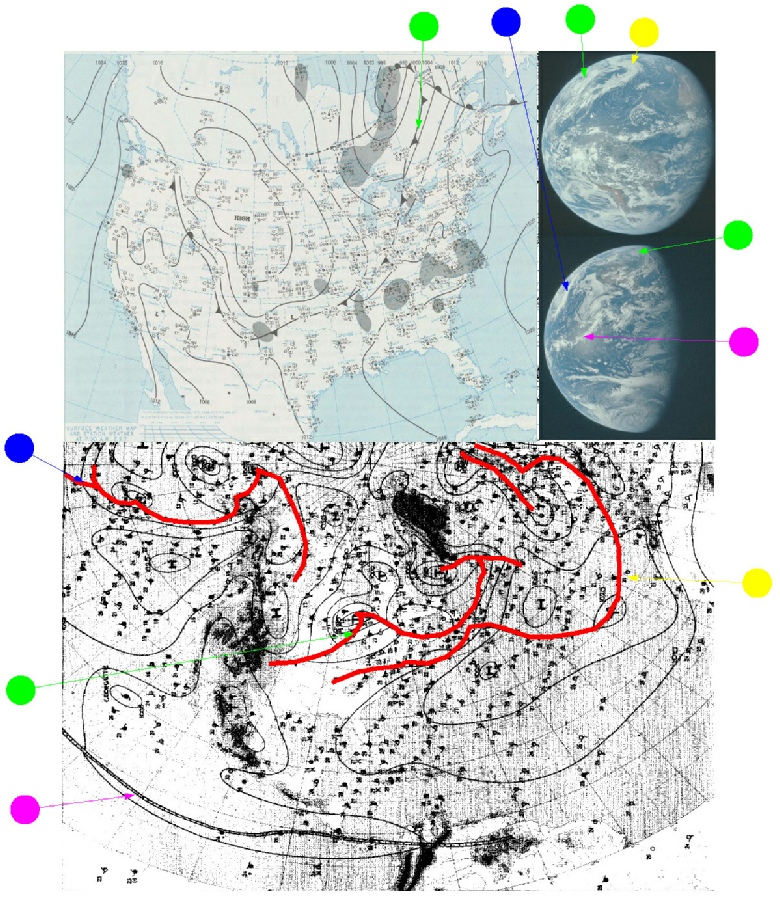
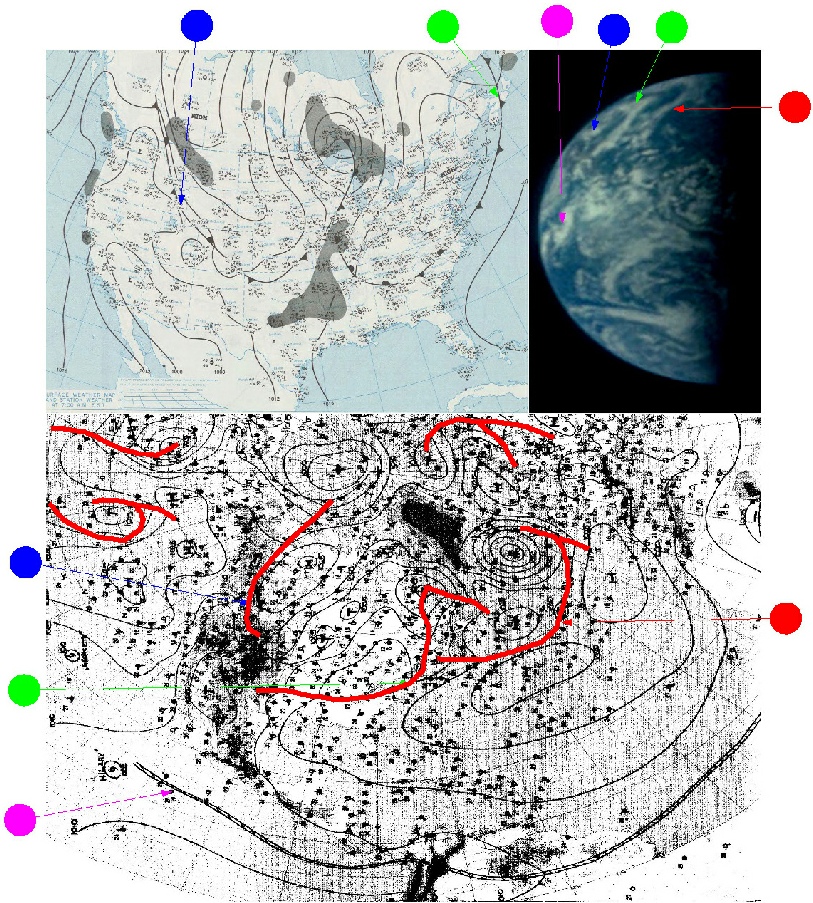
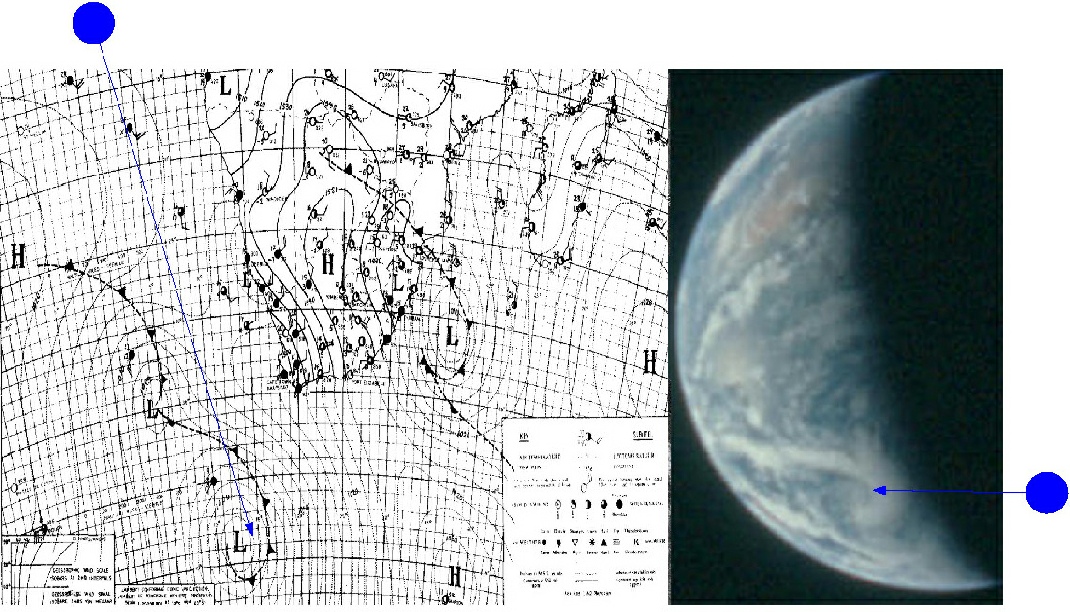
Figure 4.7.M.1: Synoptic data from NOAA (top left) and Germany (bottom) compared with AS15-91-12342 (top right) and AS15-91-12344 (right, middle)
Figure 4.7.M.2: NOAA (top left) and German (bottom) synoptic charts compared with AS15-91-12350
Figure 4.7.M.3: NOAA (top left) and German (bottom) synoptic charts compared with AS15-91-12350


