4.8.M - Apollo 16 Synoptic Charts
As with previous missions, the main sources of information for synoptic charts is the German and South African data held at NOAA, and the daily charts also held by NOAA. However, none of the Apollo images feature Africa, so only the German and NOAA daily charts can be used. We can also include charts included in the Sarasota Herald Tribune as part of their forecasts.
The lack of Earth images available means that only 5 days are suitable for analysis. Launch day is the first for which charts are available, and figure 4.8.M.1 shows the weather charts in conjunction with AS16-118-18885.
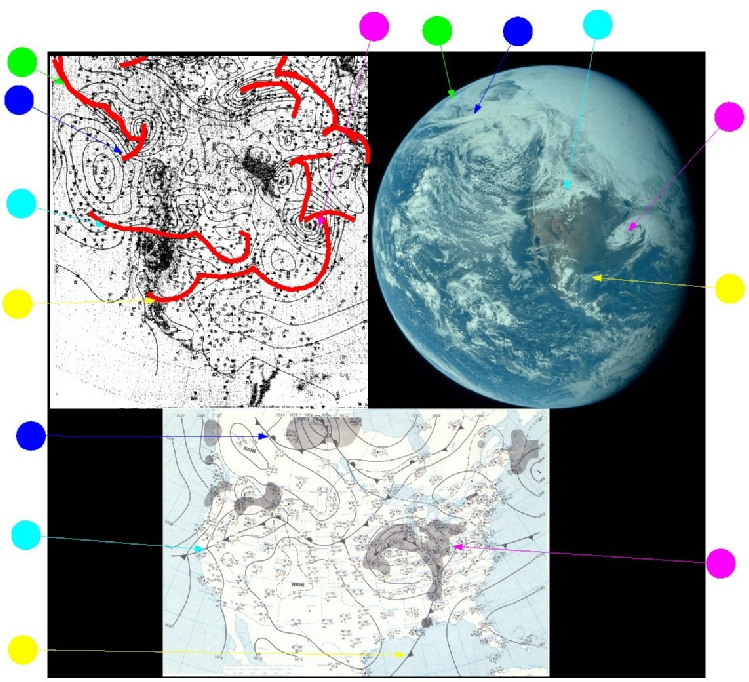
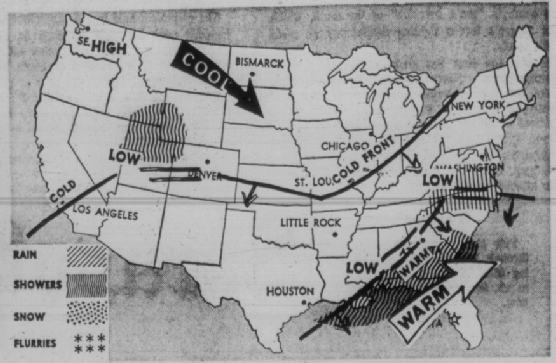
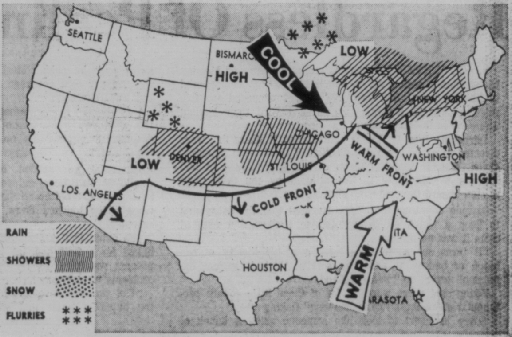
Figure 4.8.M.1: German (top left), NOAA (bottom) and media (top right) synoptic charts for April 16 1972 compared with AS16-118-18885.
Time differences between the charts, and differences in interpretation of the meteorological data from which the charts are derived account for the differences between them, but the broad patterns are consistent: the complex low towards Alaska, and two broad frontal areas acting as boundaries for the USA, leaving the continent largely clear, other than the complex system towards the east coast.
The second day's charts cover April 17th (see figure 4.8.M.2). In this image, showing much less of the globe overall thanks to the change in relative position of the Apollo craft, compares the synoptic data with AS16-118-18890.
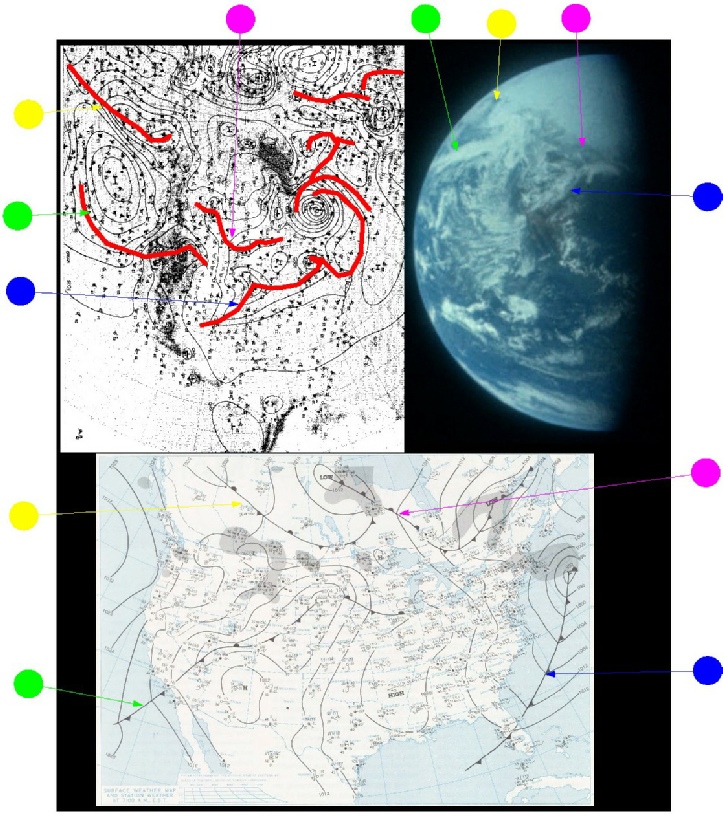
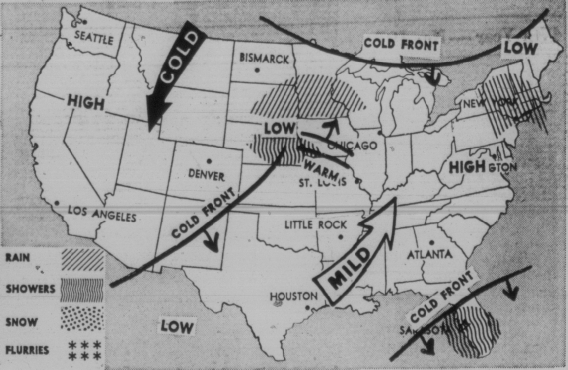
Figure 4.8.M.2: German (top left) and NOAA (bottom) and media (above) synoptic charts for April 17 1972 compared with AS16-118-18885.
The frontal systems here are relatively straightforward, although whether the yellow arrowed system on the NOAA charts is just a continuation of the one identified in magenta is one for debate. Either way there is a system in blue across the south east, green starting out in the Pacific, and the magenta one across Canada. All of these also appear on the Apollo image.
The next day's image is covered by AS16-118-18891, and is examined in figure 4.8.M.3.
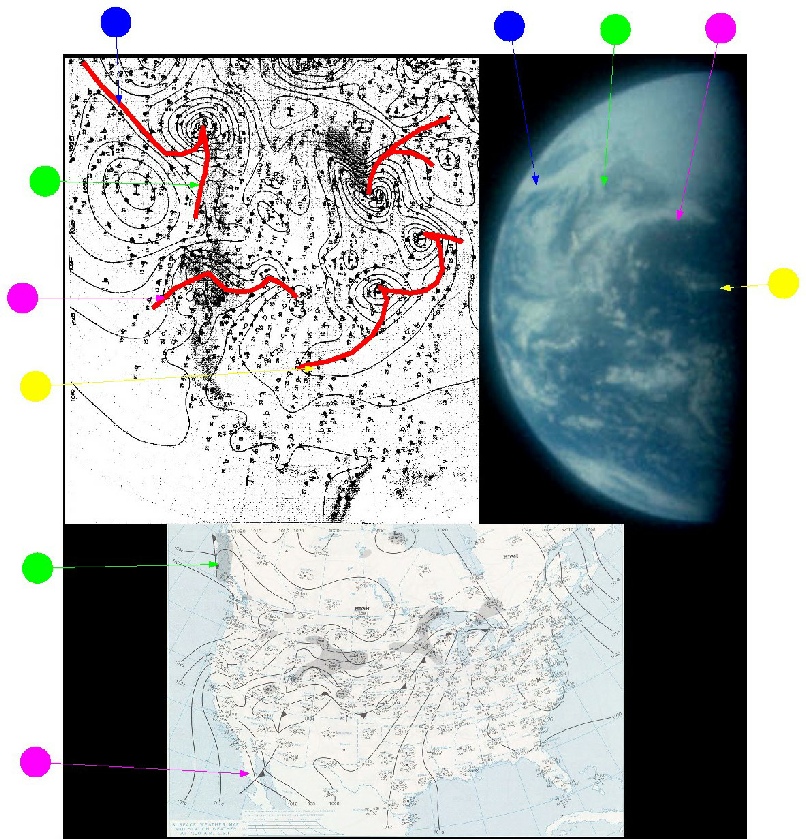
Figure 4.8.M.3: German (top left) and NOAA (bottom) and media (above) synoptic charts for April 17 1972 compared with AS16-118-188891.
Sadly the main feature of the weather on the 18th, the 'monster' storm featured in the MWL doesn't show on the NOAA chart, but the yellow arrow indicates the tail end of it on the German and Apollo parts of the figure. The magenta arrowed front is the one crossing the USA in the Apollo image.
The charts from the 19th are compared in figure 4.8.M.4 with AS16-120-19187.
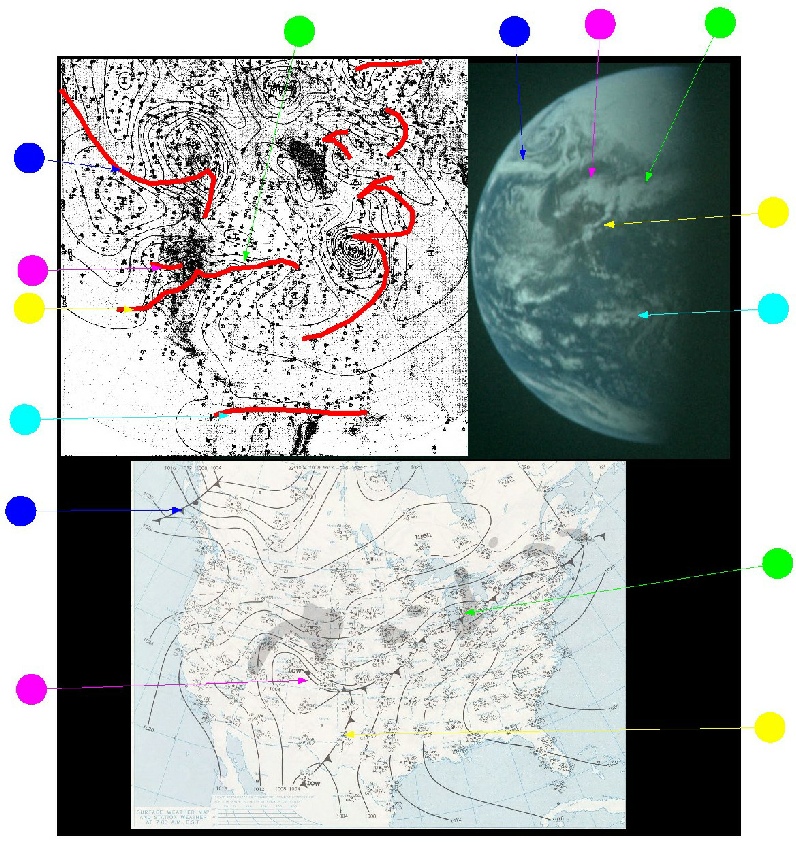
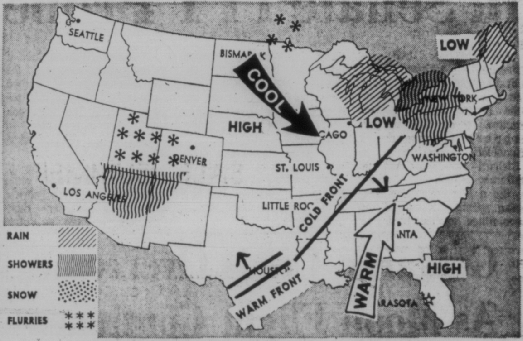
Figure 4.8.M.4: German (top left) and NOAA (bottom) and media (above) synoptic charts for April 17 1972 compared with AS16-120-19187.
The main feature evident here is the front crossing the USA, with an offshoot to the south, that is covered by 3 different coloured arrows, and this is easy to identify on all 3 of the composite parts of the figure above.
The final day's synoptic chart analysis is for April 20th, and uses AS16-113-18269. This is shown in figure 4.8.M.5.
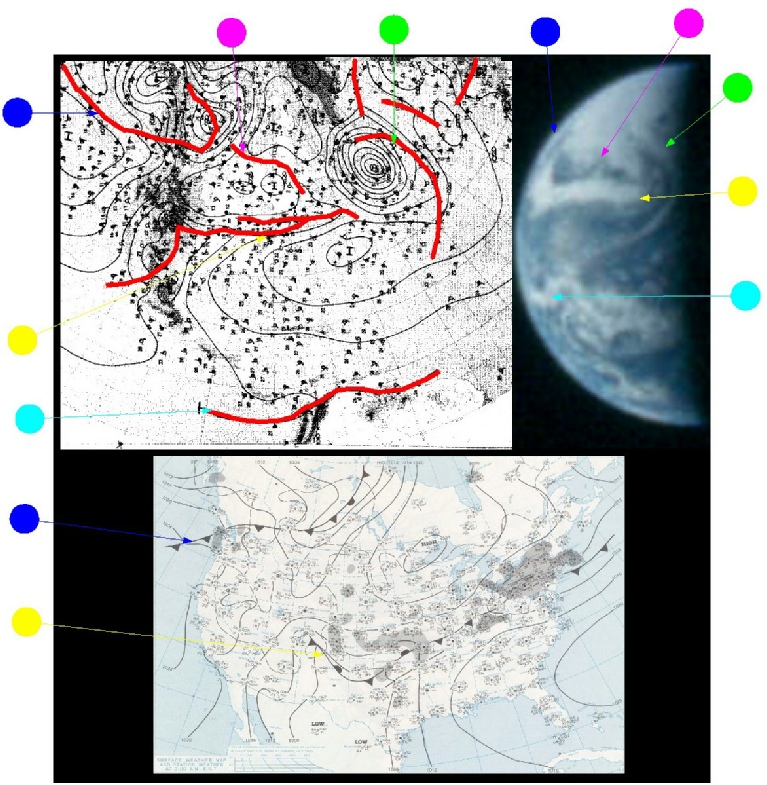
Figure 4.8.M.5: German (top left) and NOAA (bottom) and media (above) synoptic charts for April 17 1972 compared with AS16-113-18269.
Again, there may be differences in interpretation between meteorologists, but there is a broad consensus that coincides with the features shown by the Apollo image.
Another mission where the Apollo images, satellite photographs, video screenshots and synoptic charts all tell a consistent story: the photographs were taken in space on the way to and back from the Moon.