China
China’s changed their website in April 2018 so to incorporate the release of much more detailed photographic and elevation data.
There are two probes from which to get data, Chang’e-
CE1’s files are much smaller and have a lower resolution, but they are useful ones to have as a way of checking which file you need to look at in the more detailed dataset.
The data for each sections consist of a .lbl, a .tfw and a ‘.tif’ file. The lbl files can be used in GIS software, but are not always required. The tfw file is one that contains simple information about a photograph’s location.
CE2 images have recently been upgraded to consist of a few levels of resolution, the best being 7 m per pixel. Squares at 20 m and 50 m per pixel correspond to the same locations as CE1 data. All CE2 data are now given as TIF images that can be opened in most image viewers, but the 7 m dataset can be close to 1 Gb in size and may take some time to download. It is well worth checking carefully that you have the right one before grabbing it.
First, go to the link above and register on the site. I’ve not had any issues resulting from this. Next, click on ‘Scientific Data’.
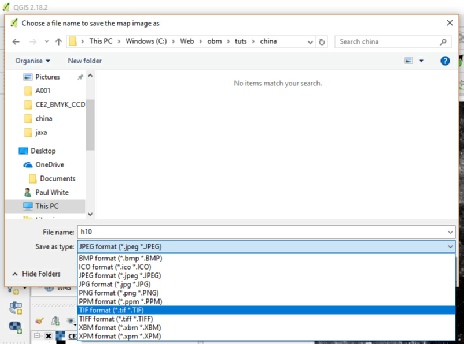
This allows you to browse over the whole image, and also to export it as an image file in the format of your choice.
QGIS allows the export of just the area shown in the frame, so you can zoom in and get a more detailed image export.
You can also drag in the DEM tiles that you’ve downloaded to produce a 3D map, and providing that you use the same map projection and scale the the photo and elevation tiles will sit on top of each other. The trickier part is when you want to load in the higher resolution 7m photographs onto the larger scale elevation ones.
I spent many happy hours trying to match the two coordinate systems without success, so in the end I resorted to a process known as ‘georectification’ or ‘georeferencing -
The following section was done on the older versions of China’s data when all I had was a global DEM to work with, but the principle is still the same -
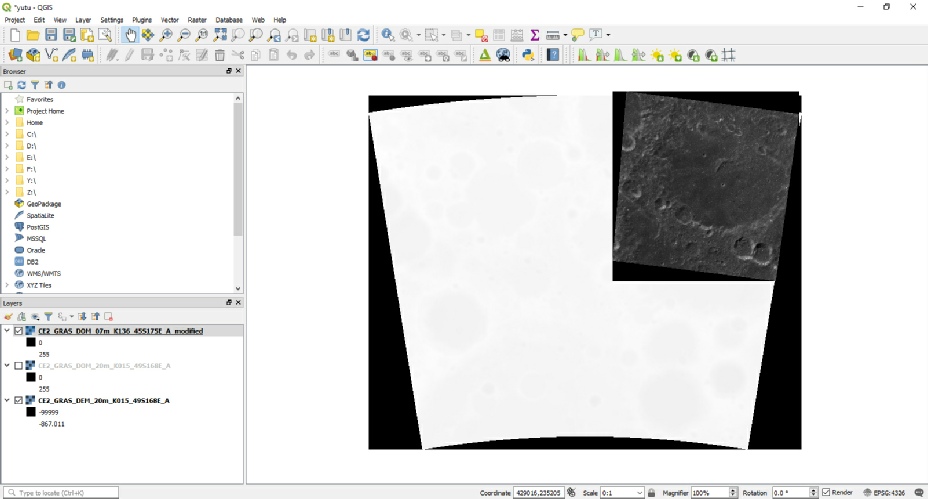
So, how does this work? The first step is, as usual, to load the DEM and photographic layers into your GIS package, and as with other probe data I‘ll be using QGIS. Here’s a view of a 20m DEM with the 7m tile correctly positioned on it.
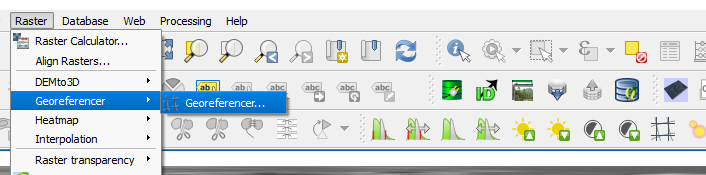
So how do we do that? Well, fortunately the 20m image file of the surface will sit in the right place on top of the topographic data, so we then need to find some common reference points on the higher resolution layer so that we can force them to sit on top of each other in the right place. To do this we need to use QGIS’s georeferencing feature, which can be found under the ‘Raster’, ‘Georeferencer’ menu, or by using the ‘hatched’ looking shortcut on the toolbar:
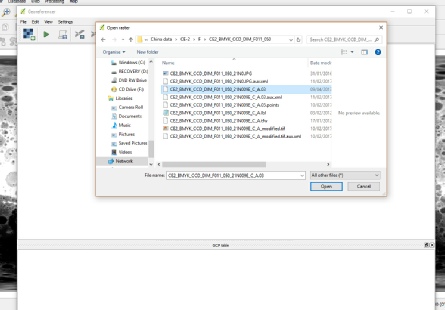
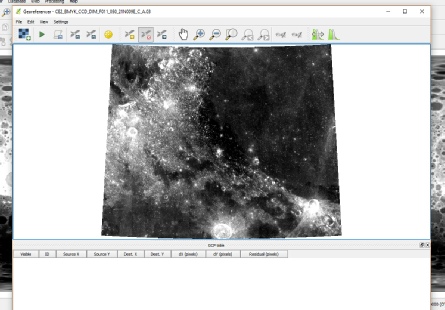
Next, click on the left-
Hopefully you can see above the role the different map projections play in things -
The easiest features to look for are craters, as they stand out on both maps, whereas a change in elevation marking a bright mountain feature could be too subtle to identify accurately. Georeferencing in QGIS needs a minimum of four co-
The next step is to tell the Georeferencer that you want to add a point, which is done by clicking the ‘add point’ icon:
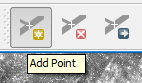
The other two icons there are ‘Delete point’ if you get one wrong (just click that icon then click on the point you want to get rid of), and then ‘Move point’ if you get one in the wrong place. My method here is to click on the exact centre of the crater I want to use as a reference. In the image below I’ve zoomed right in on a crater I’ve identified as being in both layers. Clicking first in the georeferencer window you’ll get another box pop up asking for coordinates of the point on the main map. If you actually know them then great, by all means type them in but it’s much easier just to click on the ‘From map canvas’ button and click on the equivalent point in the main GIS window. Note you can move from window to window and zoom in and out using the scroll wheel on your mouse.
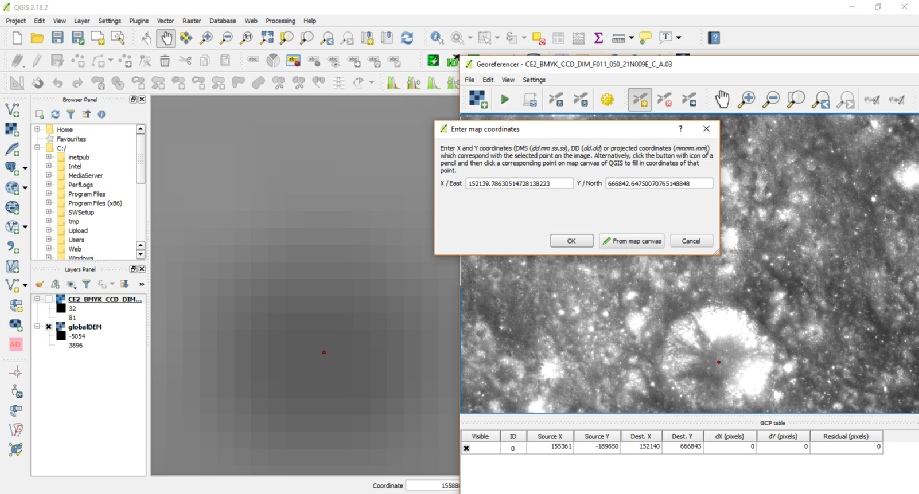
As you move onto the main window, the From map coordinates box will disappear, and it will reappear once you’ve clicked on it with the coordinates of the point you’ve added filled in in both the box and below the georeferencer window. I should point out that to save space the image above is a composite showing all parts of the process -
Repeat this process as many times as you can to get the most accurate transformation. It’s a good idea to focus your points around the area you’re interested in in case the process adds distortion. Once you’ve got your minimum of four points (the more points the better), you need to click on the ‘cog’ icon to tell it how you want to do the georeferencing. You’ll get the following:
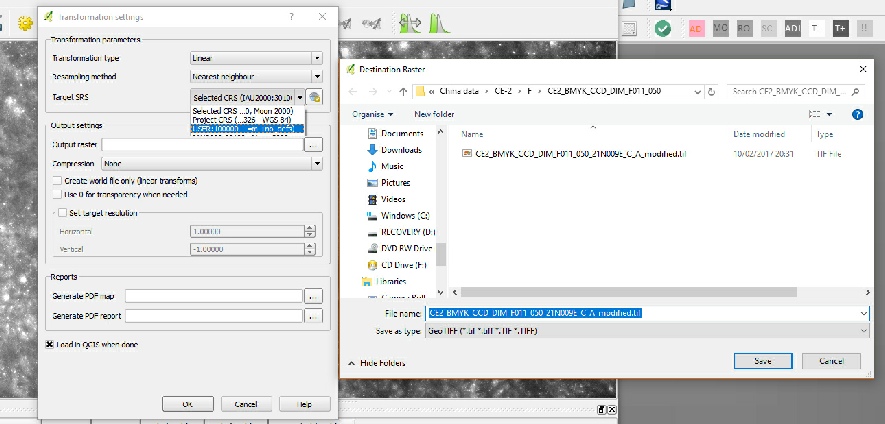
Again this is a composite window showing everything you need. By default the ‘Create world file’ tick box may be selected -
You also need to choose the ‘Target SRS’ to match the one on the map. If you forget this you can still select it in the main program when you’re done.
One important thing to change is the ‘Transformation type’, which needs to be ‘Projection’
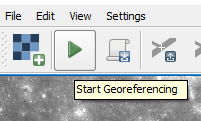
Click on OK when you’re happy. The final step is to click the big green triangle ‘Start Georeferencing’ icon.
You’ll see a couple of windows appear telling you it’s working, then some ‘OK’ buttons to click when it’s done. With any luck if you selected your referencing points accurately you should see an accurately plotted photographic layer appear. When you close the Georeferencer you’ll see messages about keeping or discarding the reference points you added -
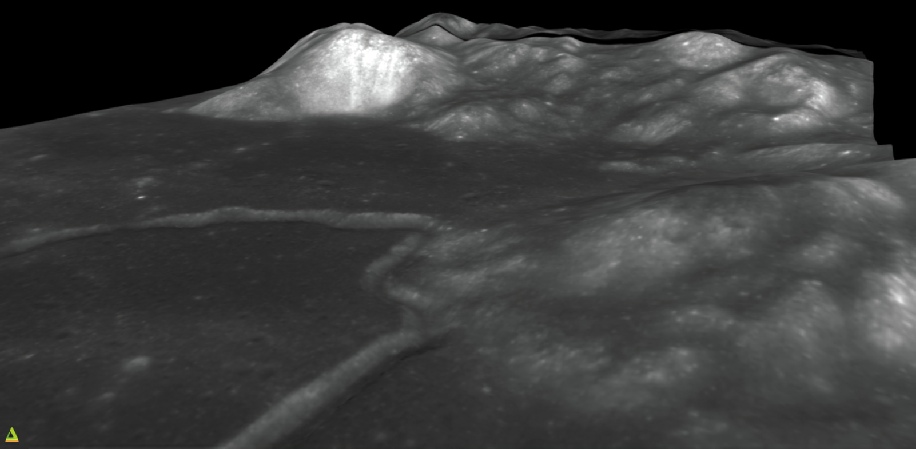
What you can also do is try and generate a 3D view using the Chinese data -
Later versions of QGIS and the 3D plugin work slightly differently. See the JAXA page on this site for more detals.
Have fun exploring China’s space data!
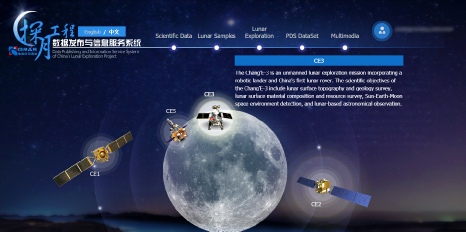
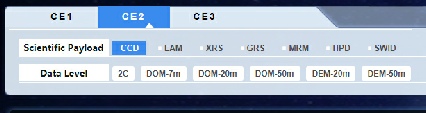
To get the highest quality image data, click the ‘CE2’ link, and choose the DOM-
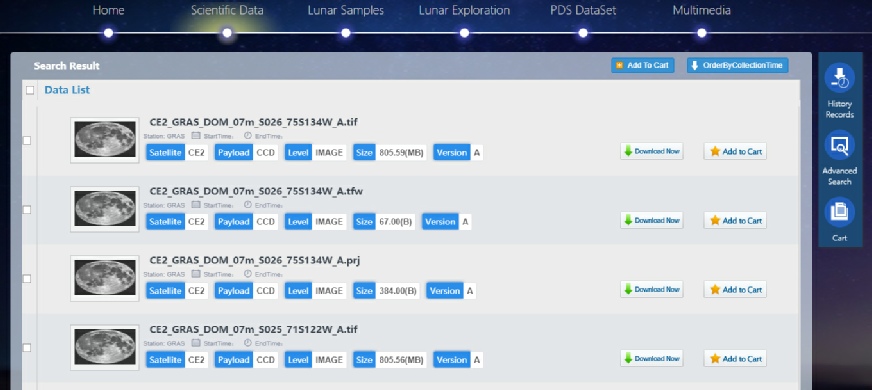
You’ll get a lot of pages of results. The files are a large size but the connection has much improved -
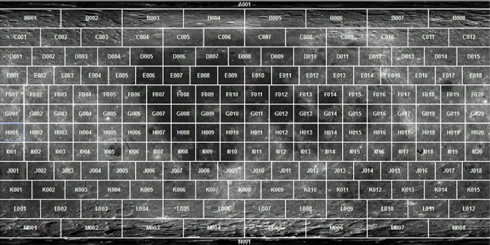
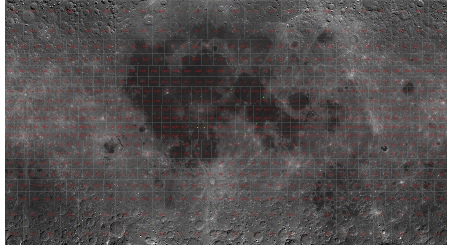
If you look at the file name, you’ll see after the ‘CE2_GRAS’ part you get a reminder of which type of tile you are looking at (DEM or DOM) and a letter and number, eg S026. These refer to the sections of the map image I posted at the top of this page. The remainder of the link is the tile’s lunar coordinate.
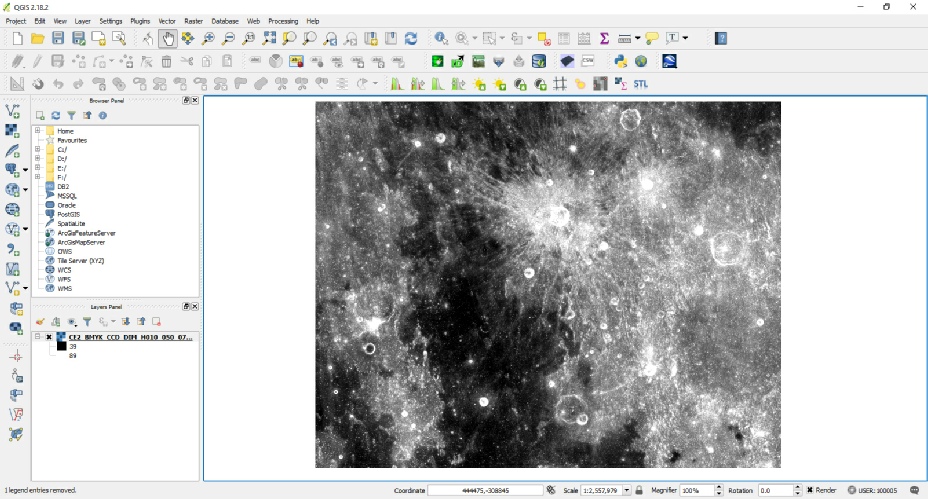
As these images are now TIF versions you can open them in pretty much any image editor you want.
One problem you tend to get with China’s images is that because thy are all based on local noon, with the sun directly overhead, there is little in the way of shadows and contrast to show fine detail. My recommendation is to increase the dpi of the image and then adjust brightness and contrast levels until you are happy with it. A little sharpening is also helpful.
If you have a GIS package like QGIS (discussed on the JAXA page here), you can load the .tif file in there by dragging it into the layers panel.