4.2.M -
Having discussed at some length the relationship between Apollo images and satellite evidence, it is again necessary, as with Apollo 8, to quickly confirm that the weather patterns indicated by satellite imagery do actually reflect terrestrial meteorological observations. Some quotes from the mission transcript may already have been referred to.
The same sources are available for Apollo 10 as for Apollo 8, but as few of the photographs available feature southern Africa clearly, the South Africa dataset is of less use. Several day's weather charts will be examined – on the way out, during lunar orbit, and on the return journey. Meteorological data are from the same sources as referenced for Apollo 8.
Figure 4.2.M.1 shows zoomed & cropped versions of AS10-
Figure 4.2.M.1: Earth from AS10-
As with Apollo 8, no meteorological expertise is claimed here, but the frontal systems, and also the areas of high pressure that tend to produce little or no cloud, marked on the charts have a clear correspondences with those on the Apollo photographs. In common with Apollo 8, the Apollo 10 crew spent some time describing the Earth to mission control, either as part of their regular TV broadcasts or as part of normal communications with the ground. Indeed it is evident in some of the conversations that Capcom are looking at weather charts and comparing them with what the astronauts are describing and the TV cameras transmitting.
At around the time AS10-
Following some news reports (including sports scores that can only have been done at the time) at 21:50 MET, the crew then begin describing features visible at roughly the time AS10-
“Arabia appears to be clear. Israel, clear. Jordan, clear. Libya and Egypt are clear except for a cloud strip along the center of the country in Saudi Arabia that runs from Saudi Arabia across the Sinai Peninsula and through Egypt. Africa is clear in the desert to the north and cloudy farther south.”
The emboldened text is important because that faint line of cloud would not have been identifiable on a synoptic chart. They also talk about
“a real weird cloud formation ...it's a real peculiar looking cloud swirl. It comes off of what looks like Labrador and goes all the way across the ocean into Europe”
This one is obviously the system identified by the cyan arrows the figures above.
This feature is mentioned again at 1 day 19 hours and 50 minutes as a
“a big long wide cloud swirl out into the Atlantic west of Spain”
after describing the clear conditions over southern Europe and Africa.
Atlantic weather conditions get more exciting for them as they move into 2 days into the mission, and by the time AS10-
“picturesque cloud formations. Swirls, not definite low areas, but big large swirls.”
Meanwhile, in a description that illustrates image AS10-
“..go straight north [from the Gulf of Mexico] you see a little bit of V in the clouds and there's one going off to the right and a little thin sliver going to the right is the one I've been mentioning all day that goes from Indiana on through the north-
The magenta & yellow arrows pick out the 'V' they describe. Off Los Angeles the tell Capcom:
“you've got some clouds Just off the west coast of California that seem like they come Just short of the coastline.”
Capcom also describe what they can see, identifying the clouds running off the west coast of central & north America (cyan arrow):
“We have one section of clouds that looks like it is almost a circular area – a clear area and then clouds appear to come out of South and Central America -
Capcom are also looking at weather charts at this point and comparing them with what they can see on the TV images from Apollo:
“We're looking at a weather map that was Just brought in...The clouds are over Oklahoma and your description is excellent...There's a low pressure up in the very far north turning from the Great Lakes north eastward into -
and also:
“It looks like this cloud system out in the Pacific is associated with another low-
The synoptic chart for that day for north America, and the German charts for the northern Hemisphere are given below, and it is clear from these the cloud patterns over north America, south of Alaska, and the complex and picturesque patterns on the Atlantic are all reflected in the synoptic charts of the day (figure 4.2.M.4).
The orange arrow is the low pressure they pick out south of Alaska, & the red arrows pick out the 'picturesque swirls' in the Atlantic off Spain described earlier. Comparison of the charts from the 19th and 20th of May shows, just as the photographs do, that the weather systems do not exist in isolation but are part of an evolving pattern.
The astronauts do not describe much of the weather systems during their orbit around the moon, pointing out that
“we were kind of busy”
but we can fall back on the photographs taken during orbit and compare those with the available weather maps. Figure 4.2.M.5 contains all 4 Earthrises shown earlier in this analysis from May 23rd, and the US & north Atlantic synoptic charts and with the main weather systems identified. The main weather systems off the east coast of the USA, the chaotic system off Europe is still evident, as are the large swirls off Alaska.
By the 24th of May, the crew were on the way home and able to resume their regular weather reports, for example:
“You see that big circular weather belt that goes up across the United – up across the east coast of the United States, covers up Florida, and. it appears that some sort of point is in the Gulf of Mexico Between Florida and Texas. It's difficult to make out any landmasses and I doubt that you can see any, hut with the monocular, I can see Cuba, Haiti, and the Indies, end most of South America which is cloud cover. The central United States appears to be open, as well as the western United States...There's a great big -
They do describe the former system as covering over Florida, which it does not do in the satellite image, but given that they are still 184000 miles from Earth it is possible that they have misinterpreted what they were seeing. It's also possible that the ESSA image has failed to pick up lighter cloud cover, or that they are actually describing the much larger belt of cloud that arcs over the north Atlantic, a part of which does go close to southern Florida.
These weather patterns are still visible on the 25th, when better coverage of the USA is available in image AS10-
“that big low-
This circular system is clearly visible on AS10-
The Earth as seen on those two images are shown in figure 4.2.M.6, annotated along with the synoptic charts for the north Atlantic and north America. There is no useful angle on South Africa, so this chart will not be used.
Close inspection of north America, the main area that is visible on both images, shows that the weather systems do match up, confirming that they are from the same date.
As with the other synoptic charts, there is no difficulty identifying the same frontal systems on the Apollo images.
In summary: Apollo 10 images taken by the astronauts can be precisely pinpointed in time with the use of satellite images, and the weather systems on those Apollo photographs match with the satellite data. Images produced by TV broadcasts and recorded on 16mm video also match, giving further support to the already considerable body of evidence that Apollo 10 went to the moon, orbited around it, rehearsed the landing that would take place by Apollo 11 and returned home.


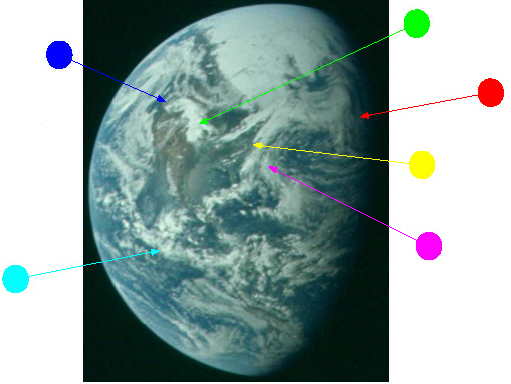


Figure 4.2.M.2: US, North Atlantic & South African synoptic charts for 19/05/68
Figure 4.2.M.3: Section of AS10-
Figure 4.2.M.4: Annotated US & North Atlantic synoptic charts for 20/05/69.
Figure 4.2.M.5: Annotated US & North Atlantic synoptic charts for 20/05/69.
Figure 4.2.M.6: Annotated amalgamation of (from left to right), AS10-