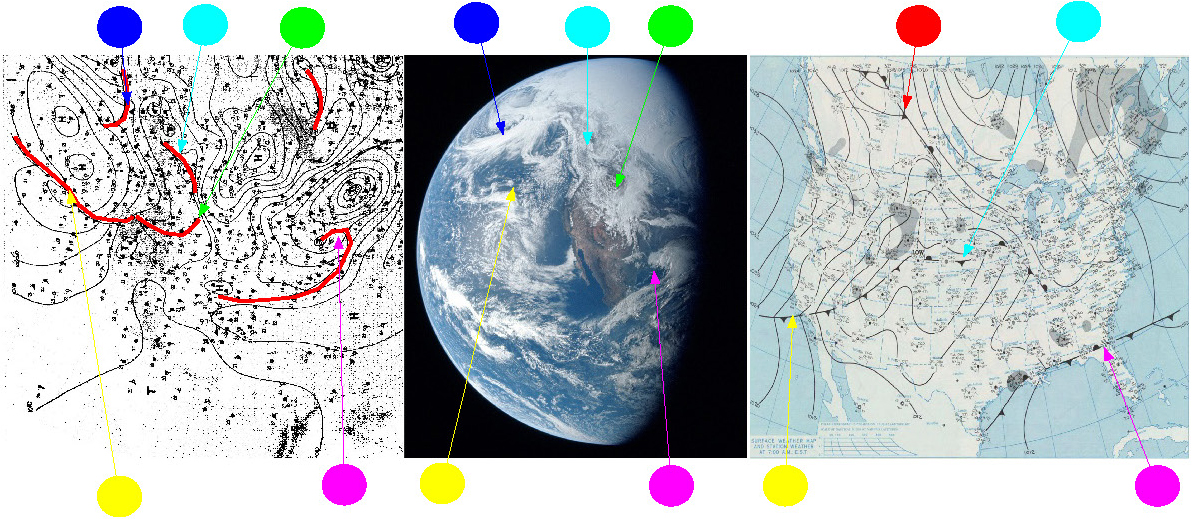
Figure 4.5.M.1: AS13-60-8588 compared with German (left) & NOAA (right) synoptic charts, and a weather chart published in the Sarasota Herald Tribune on April 12th.
Again, as with preceding sections no claim is made to any great degree of meteorological expertise, and those more expert are welcome to provide their own views as to which fronts correspond to which cloud masses. The front over the gulf seems simple enough to identify, and the German chart even shows the curl of the cloud band off the east coast.
Although less obvious as a band of cloud, the stretch of clear ocean above the front marked in yellow seems to match up. The blue arrow (not shown on the NOAA chart) would appear to correspond with the system off Alaska.
There is, again, no inconsistency in the meteorological charts available and the weather patterns displayed in the Apollo image.
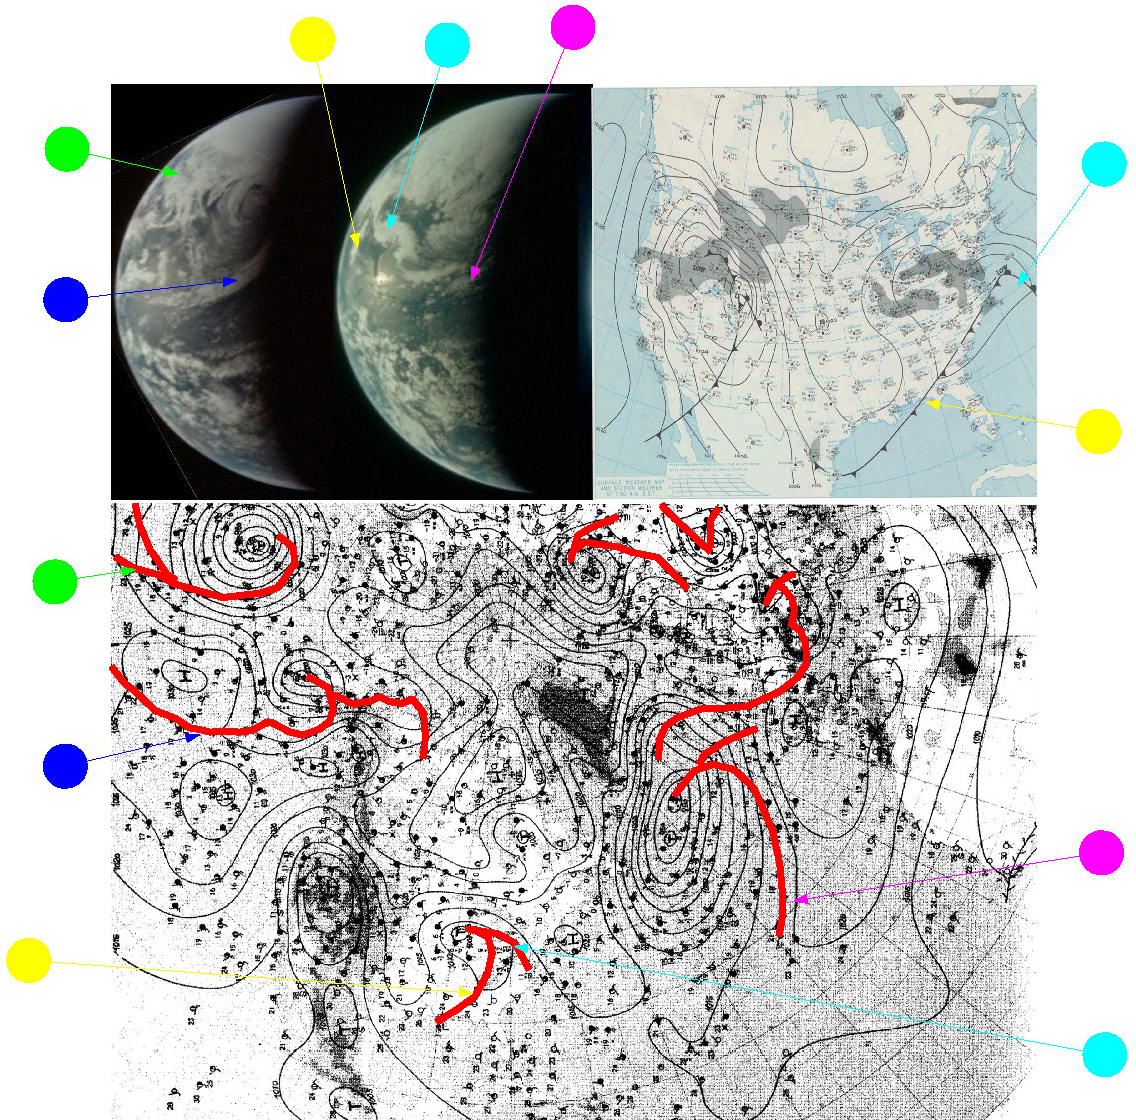
The next brief examination of meteorological charts is for April 14th. The two images to be used have already been examined in the previous section and show the Atlantic, with a small portion of the Eastern US seaboard (AS13-60-8601), and the Pacific ocean (AS13-60-8716).They can be compared with the NOAA and German synoptic charts, and this is done in figure 4.5.M.2.
Figure 4.5.43: AS13-60-8716 (top left) and AS13-60-8601 (top middle) compared with German (bottom) and NOAA (top right) synoptic charts. German data is at 00:00 on the 14th, NOAA at 12:00 on the 14th, and a weather chart published in the Sarasota Herald Tribune on April 14th.
.
It should be noted that there is a difference of opinion as to whether there is a front associated with the depression over the Rockies between the NOAA and German charts, but this area isn't covered by either of the images so it is difficult to suggest which is correct. It is possible that the time difference between them accounts for the difference in interpretation, their being some 12 hours apart.
The other fronts are clearly visible in the photographs, although it should be acknowledged that the cloud pattern off Florida is more difficult to ascribe accurately. It is the contention here that the cyan arrowed front matches that on AS14-60-8601, and the clouds that connect with it across the Atlantic are those from the magenta arrowed front. The author is always open to other explanations.
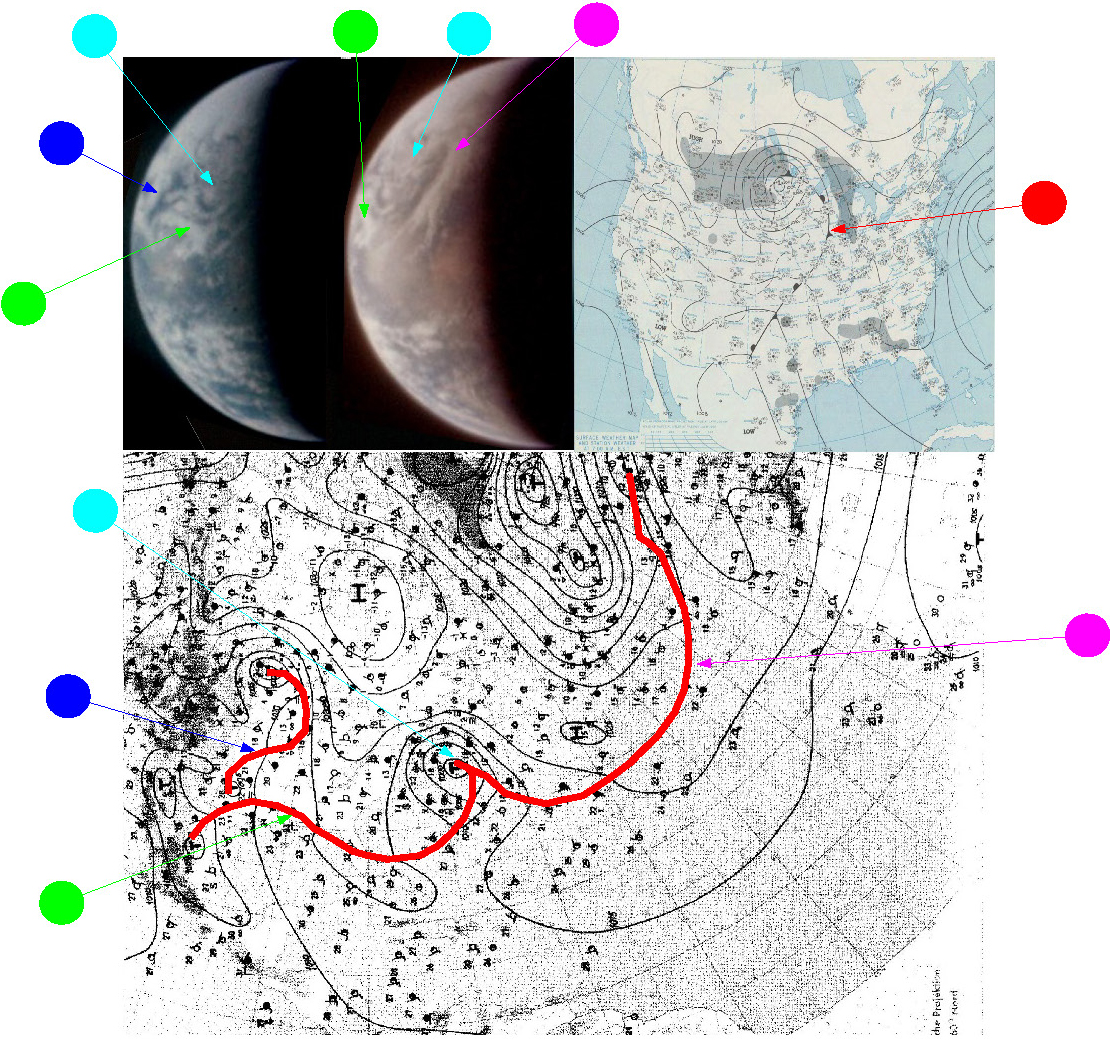
One final day's synopses will be examined before moving on to study Apollo 14, and that will be the final day for which Apollo images are available: April 16th. AS13-62-9038 and AS13-62-9012 cover the western and eastern Atlantic respectively, and German & NOAA charts should cover both (figure 4.5.M.3).
Figure 4.5.44: AS13-62-9038 (top left) and AS13-62-9012 (top middle) compared with NOAA (top right) and German (bottom) synoptic charts for April 16th 1970, and a weather chart published in the Sarasota Herald Tribune on April 16th.
.
As with previous synoptic examinations, there is no discrepancy between the synoptic data collected on the ground and the Apollo images taken in space. The most reasonable explanation for this has been made many times: the Apollo images were taken from space, on the days they have always claimed to have been taken.
4.5.M Meteorological evidence
The same sources used for previous sections are again available here (the reader is referred to those sections if they wish to check them themselves), but as with Apollo 12 the ever diminishing crescent of the Earth and the fact that the majority of photographs show areas not covered by the synoptic charts limits the number of possible comparisons.
April 11th did, at least feature good coverage of North America, which allows us to revisit AS13-60-8588, Figure 4.5.M.1 shows the NOAA & German synoptic charts for April 11th compared with that NASA image.


