4.2.9 Apollo 10 Images – Day 9: May 26th
Day 9 starts with a view of that weather system mentioned at the end of day, now much more clearly visible in AS10-
Figure 4.2.9.1: AS10-
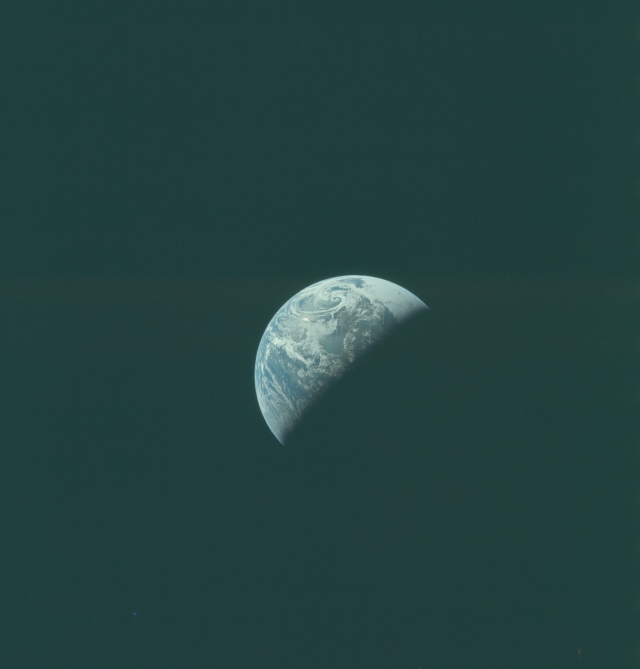
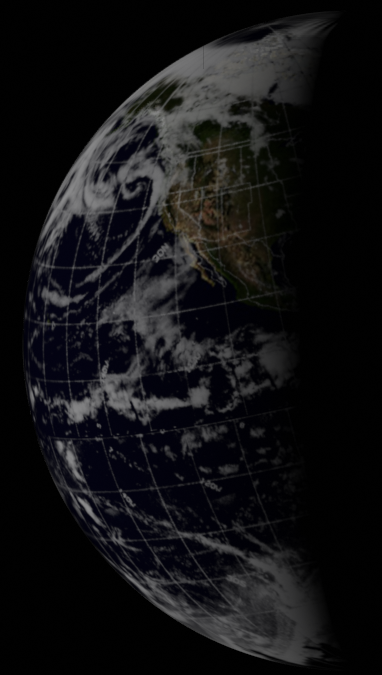
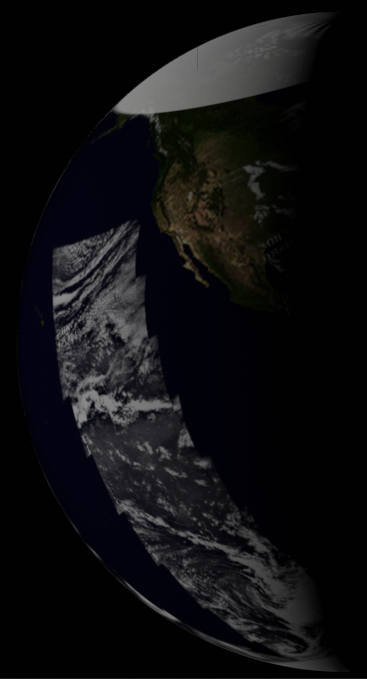
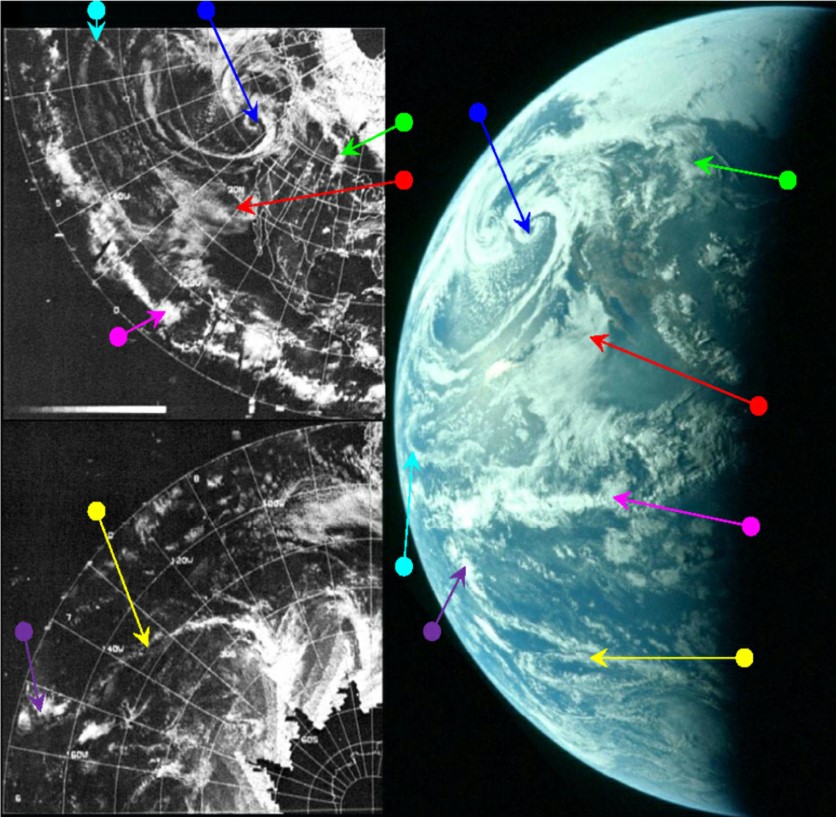
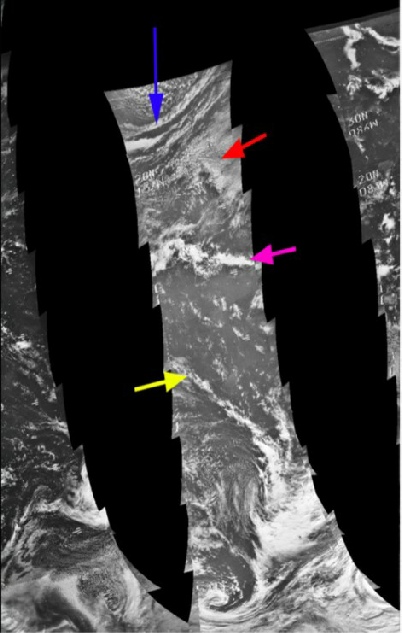
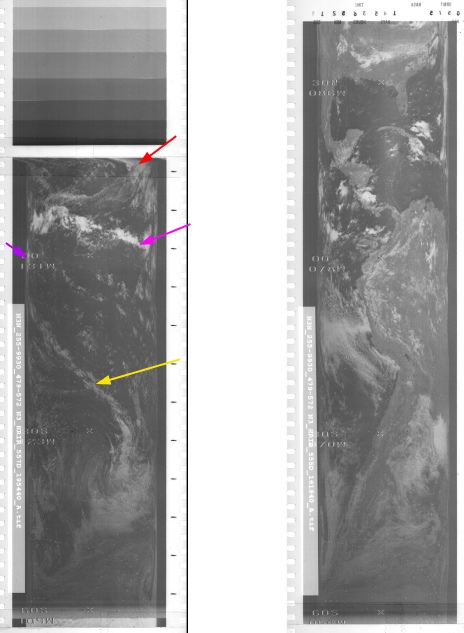
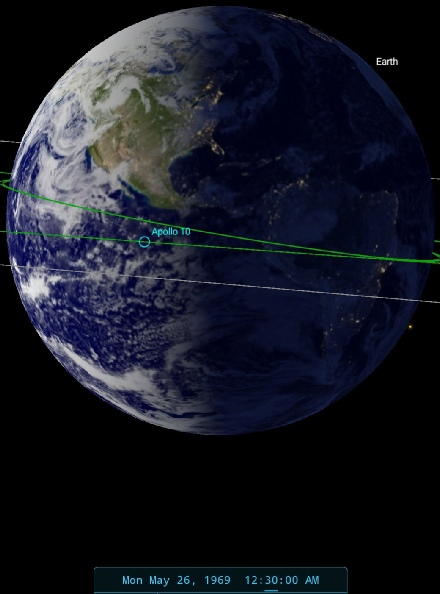
Figure 4.2.9.2: Main image -
The large spiral (blue arrow) system off the west coast of the USA has again changed its appearance, re-
SkySafari puts the time at 00:30 on the 26th. ESSA's 'best fit' orbit would be number 1106 (track 4), which commenced at 21:07. NIMBUS' equivalent would be orbit 555, which commenced at 16:38 on the 25th. We’ll wait for more Earth rotation before looking at detailed NIMBUS scans.
We also have a matching 16mm image for this shot, again from Magazine D, shown in figure 4.2.9.3.
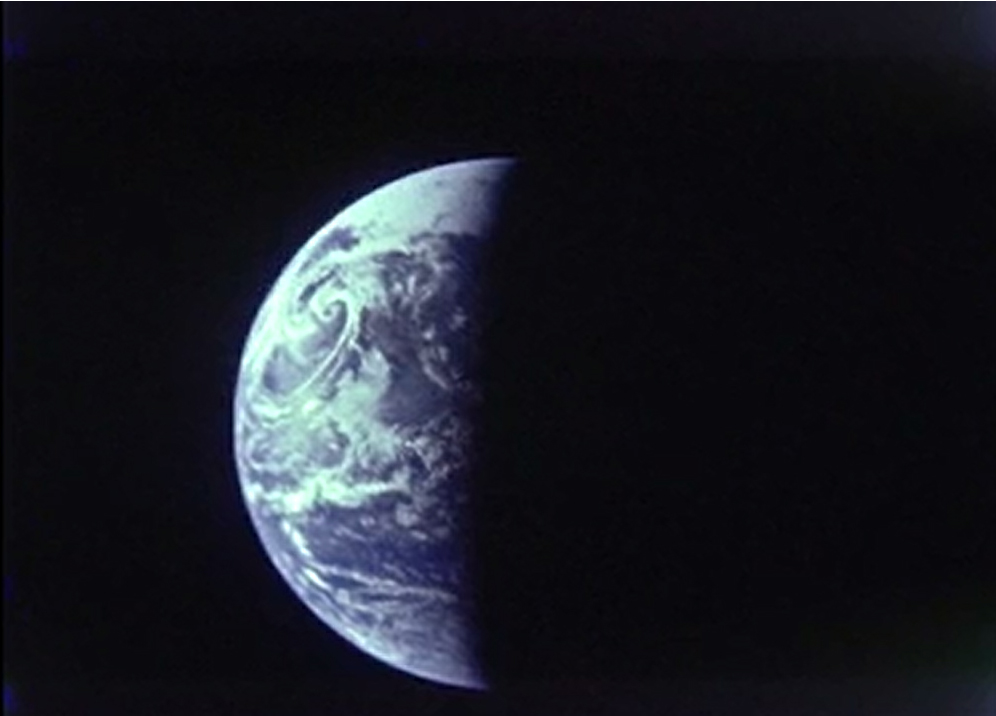
Figure 4.2.9.3: Magazine D still showing Earth.
The next image in this sequence was taken not long after, but long enough for almost the entire American continent to have vanished beyond the terminator. AS10-
Figure 4.2.9.4: AS10-
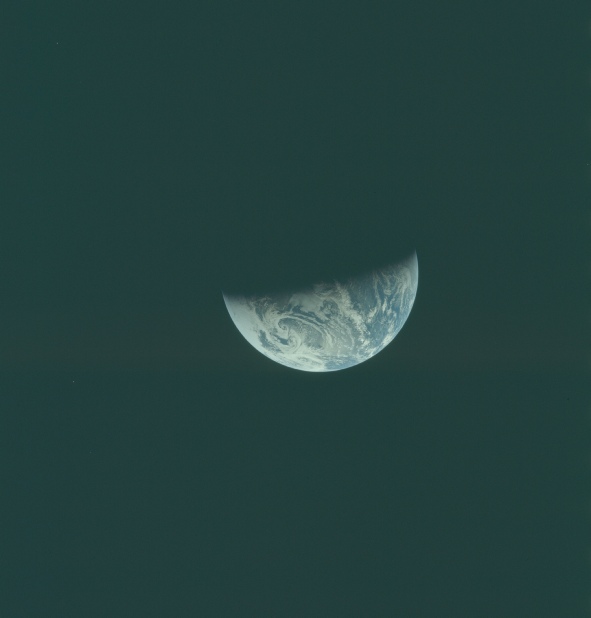
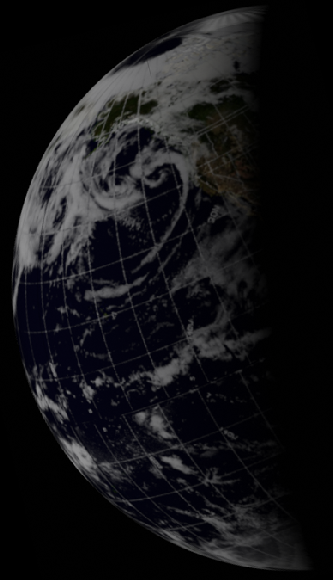
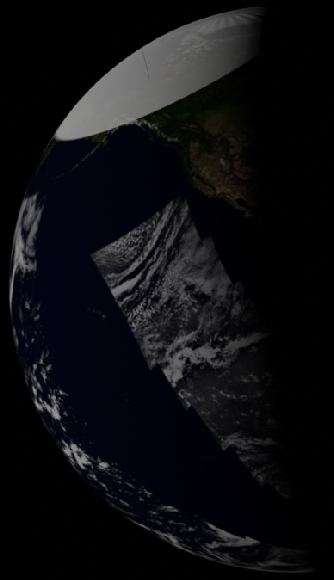
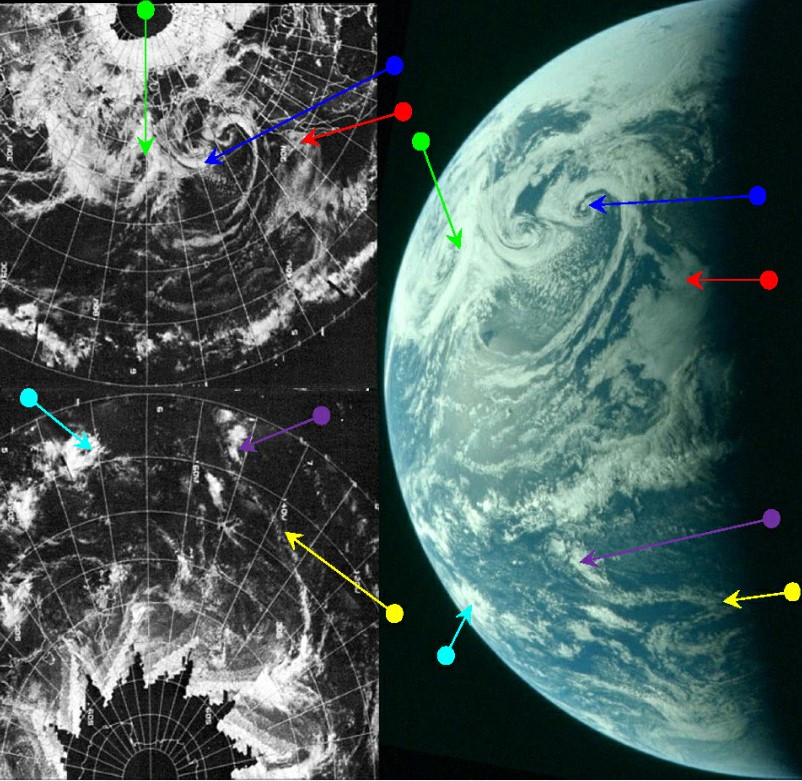
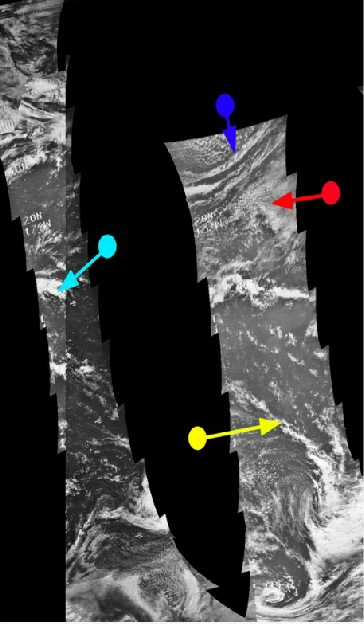
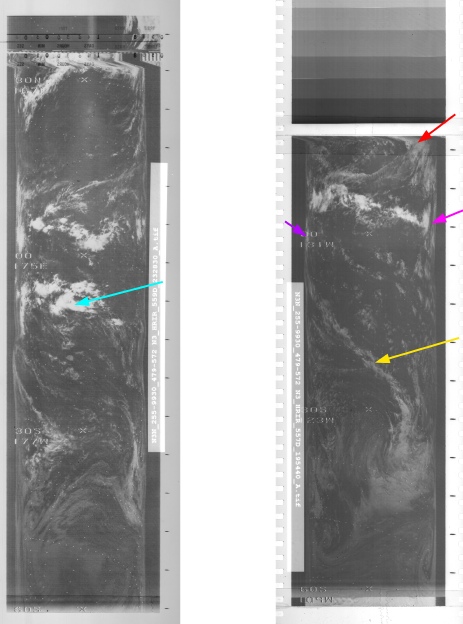
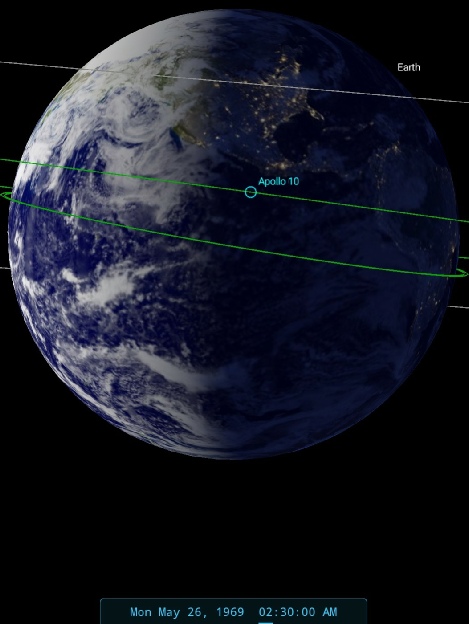
Figure 4.2.9.5: Main image -
The large spiral has moved much closer to the terminator, which now has most of the USA in darkness. Just emerging on the western horizon is another spiral of cloud (marked in green), and this is the system that is visible in the final image on magazine 27.
The blue, red, cyan and purple arrows used in figure 4.2..9.5 are the same as those in figure 4.2.9.1. The terminator gives an estimate of around 02:30 on the 26th.
The satellite timings are pretty much one orbit along from the previous image. ESSA's nearest orbital pass covering the terminator is number 2303 (track 5), commencing at 23:07 on the 25th, while NIMBUS' best orbit is 556, commencing at 18:26 on the 25th. The area covered has changed slightly thanks to the Earth’s rotation in the time elapsed between photographs, which brings an additional HRIR image into play. Here’s a close up from that image (figure 4.2.9.6).
I just don’t get tired of repeating it: the satellite record vindicates the fact that Apollo went to the moon, and the image shown above is just one of a long line of examples where meteorological satellites match the Apollo photographs exactly. In this example there is around 3 hours between the NIMBUS image (started at 23:28) and Apollo, but again a hefty part of that three hours includes the rest of the satellite pass over the daylight side, then transmitting the data back to Earth at a receiving station in the US and transferring that data to the Goddard Space Flight Center for processing.
The final image in the sequence of regularly spaced Earth photos examined from magazine 27 is one of an identical pair, AS10-
Figure 4.2.9.6: Section of NIMBUS-
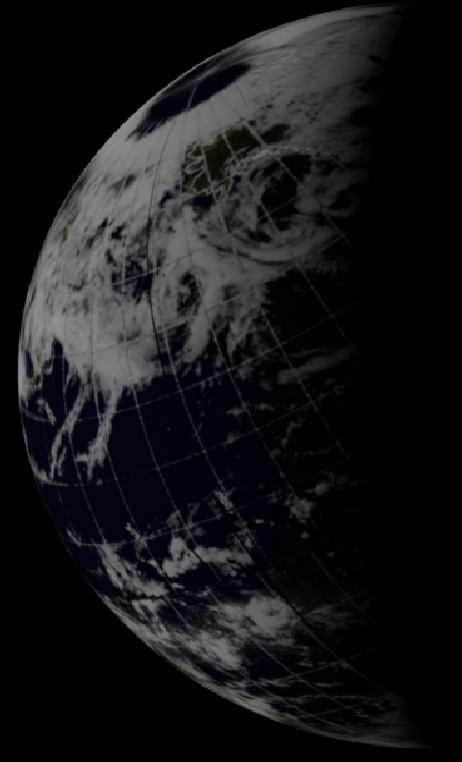
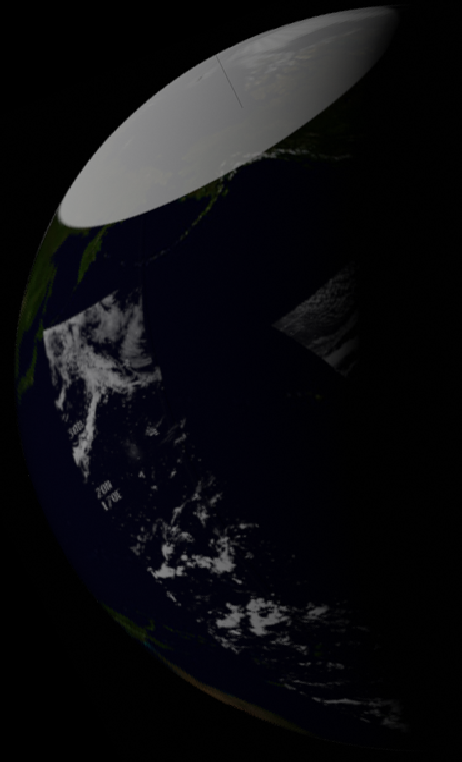
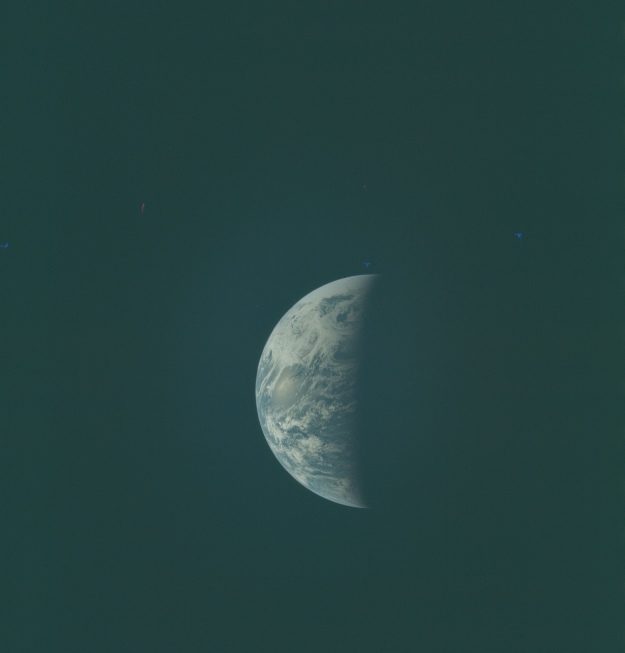
Figure 4.2.9.7: AS10-
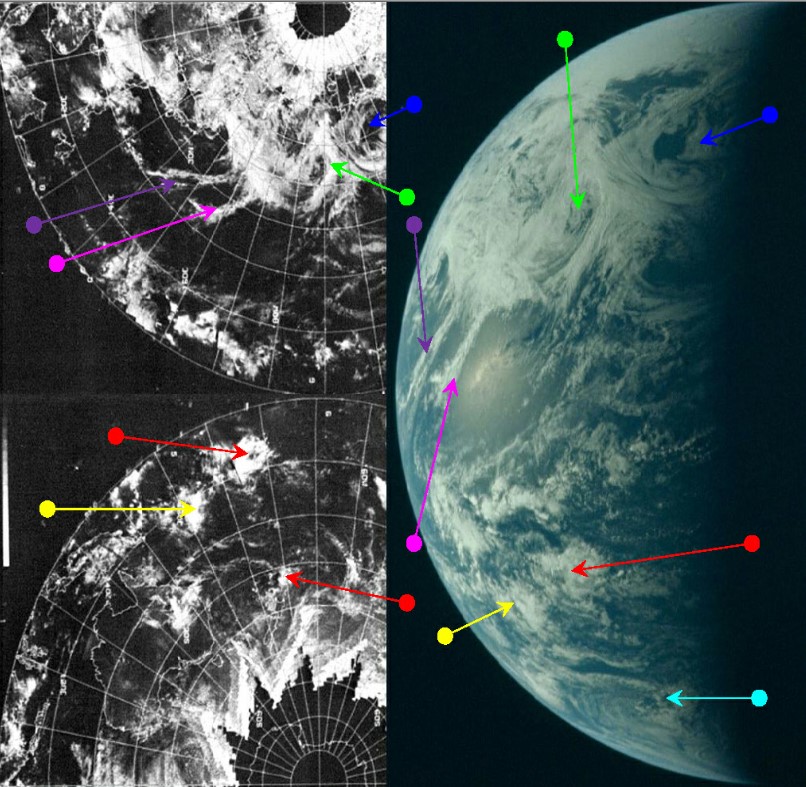
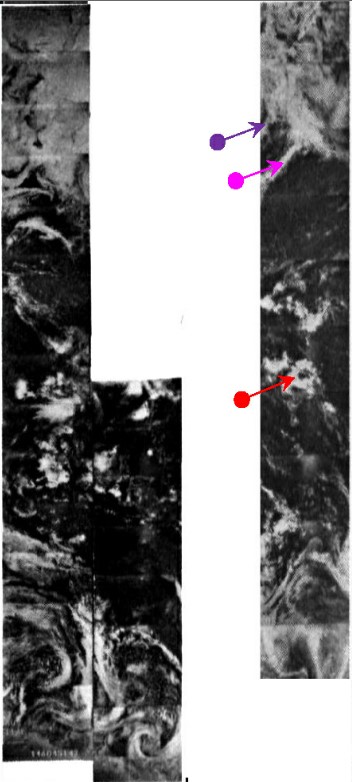
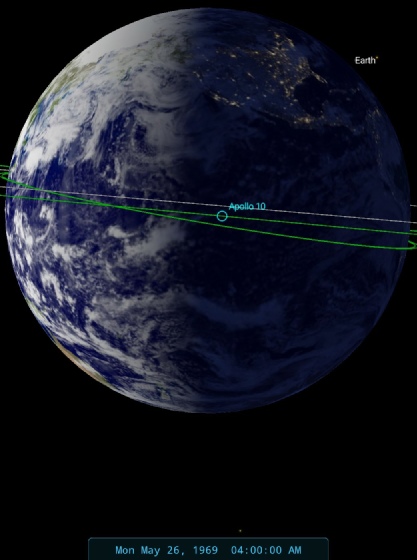
Figure 4.2.9.8: ESSA 9 (left) and NIMBUS 3 (cenre left) images compared with AS10-
There is still a small amount of the large spiral system off western north America (blue arrow) but the main weather system in the northern hemisphere is the green arrowed system to the west of that.
South-
In terms of the satellite images, their coverage of the area over the terminator starts with ESSA at orbit 1108 (track number 6), commencing at 01:08. In fairness, the terminator covered by ESSA is probably somewhere between tracks 5 and 6, just as with the previous figure the terminator was somewhere between tracks 4 and 5. NIMBUS doesn't cover much of the area shown in the resampled modern version of the IDCS, so the main image shows the older scan of the HRIR image. The terminator is probably best covered by track 558, commencing at 22:01 on the 25th. Seeing as we can, let’s zoom in again on one small part of the Apollo image and compare it with a NIMBUS pass, again from orbit 559, this time looking at an area that was at a more oblique angle before (figure 4.2.9.9).
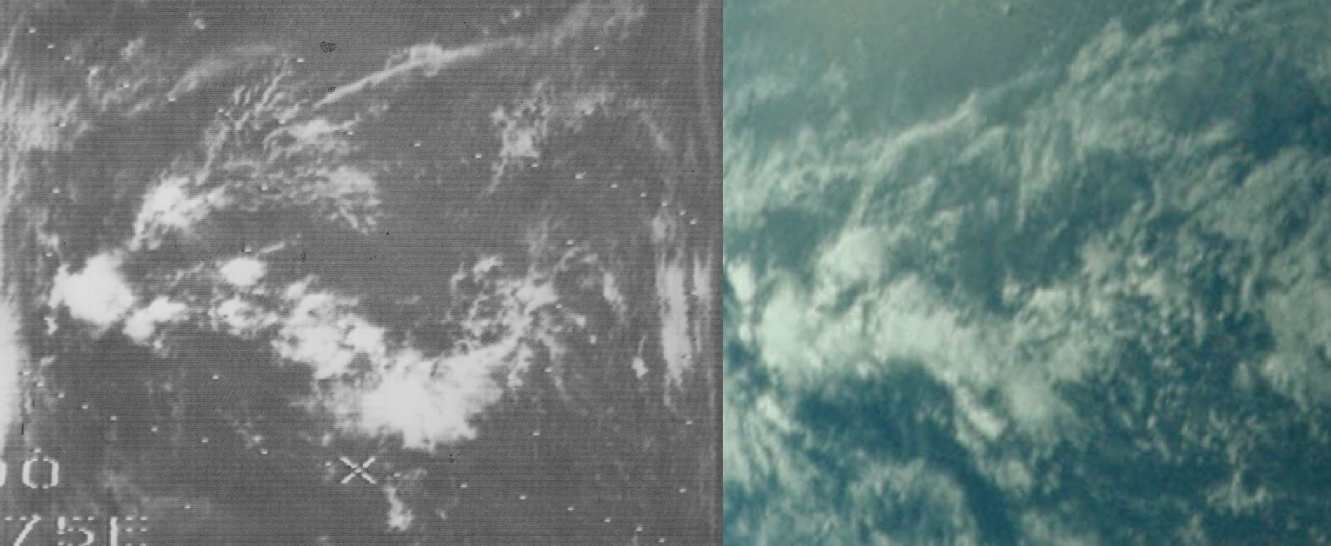
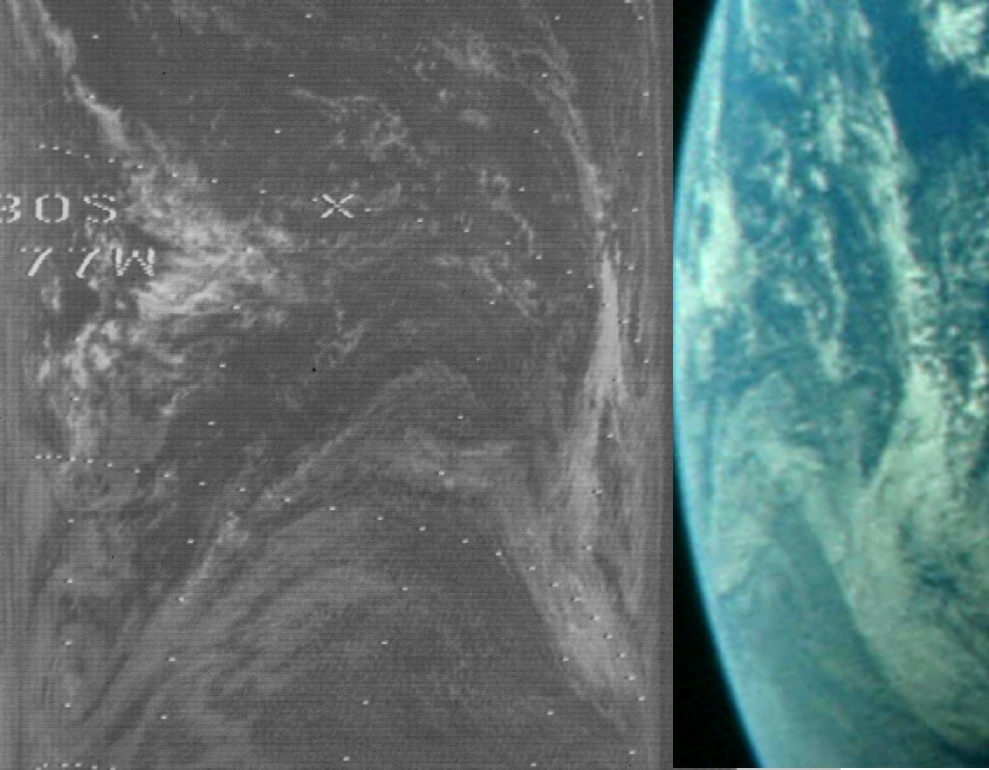
Figure 4.2.9.9: Section of NIMBUS-
Once again the match is almost perfect, barring subtle changes caused by the time lapse between the two and the different spectra photographed.
We also have another 16mm still taken at the same time, as shown in figure 4.2.9.10.
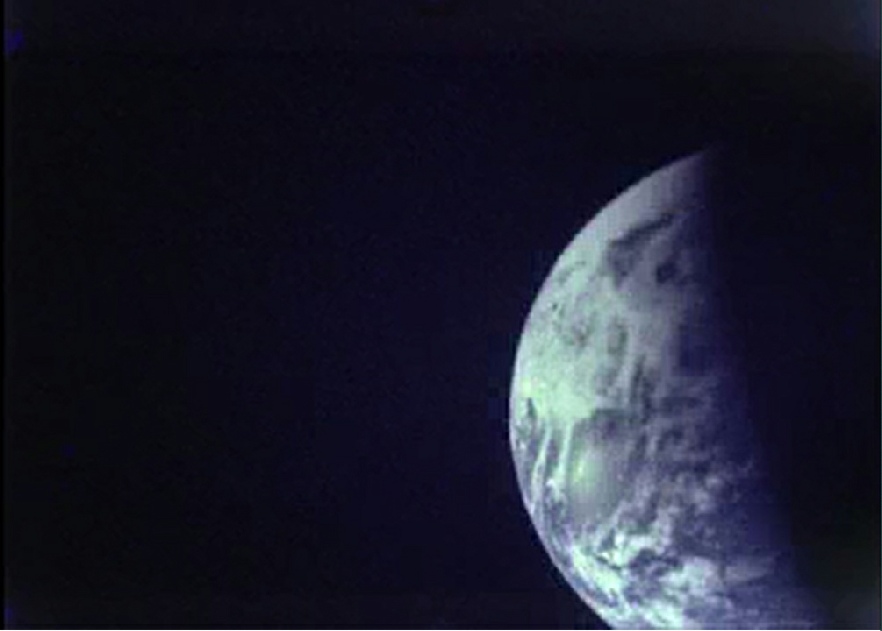
Figure 4.2.9.10 16mm still taken at the same time as AS10-
The final colour image to be analysed is AS10-
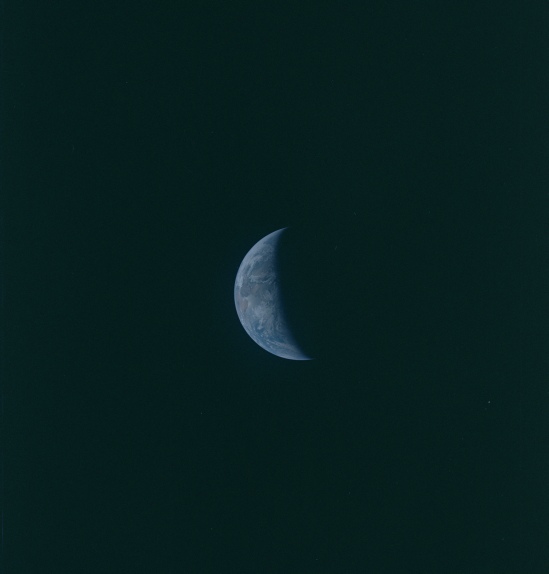
Figure 4.2.9.11: AS10-
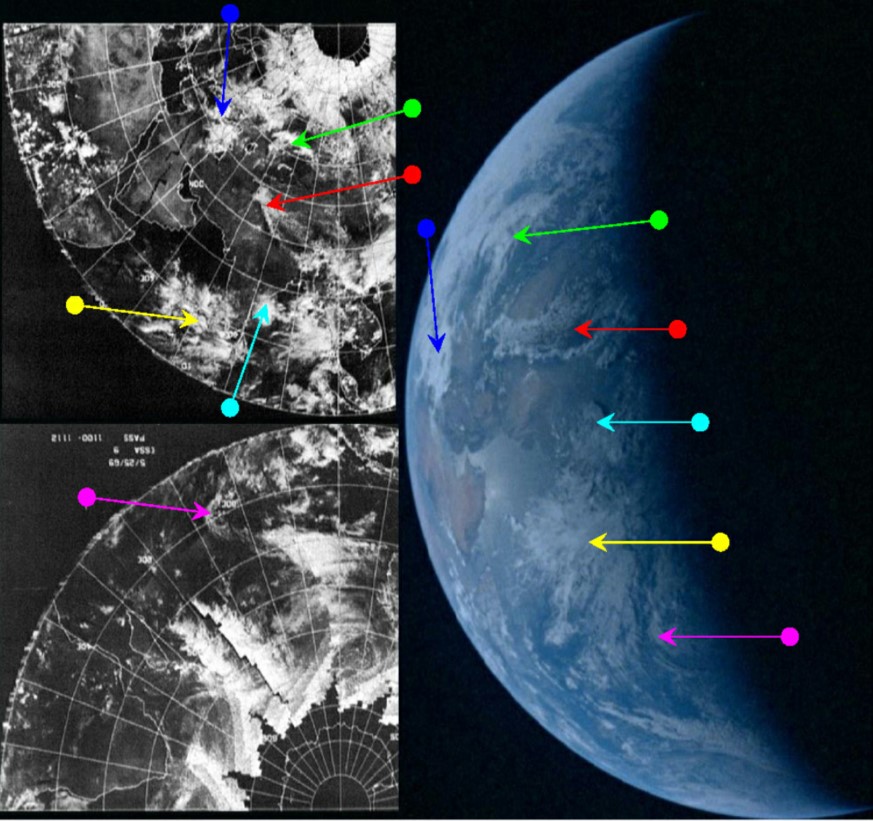
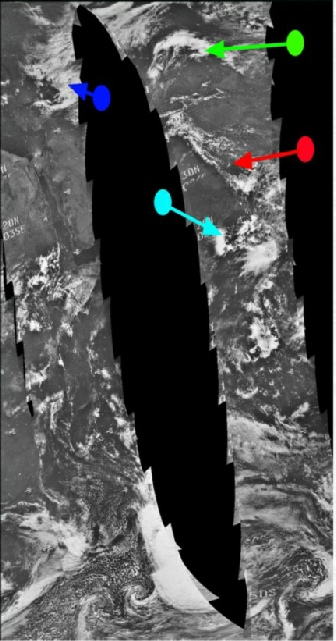
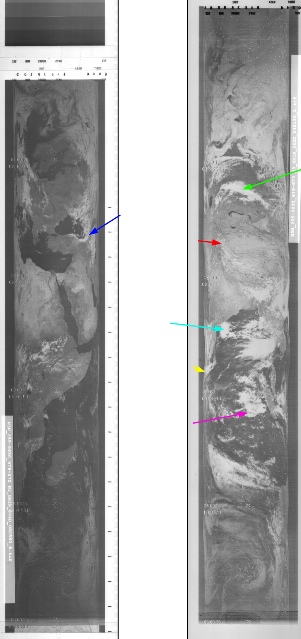
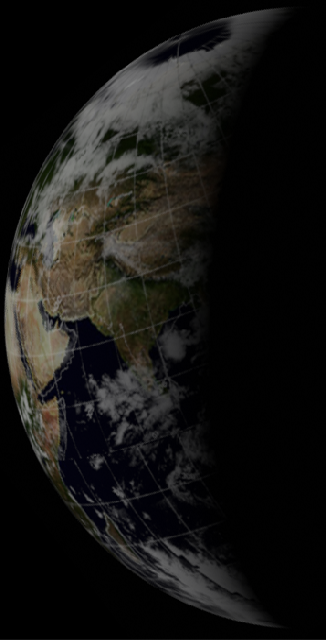
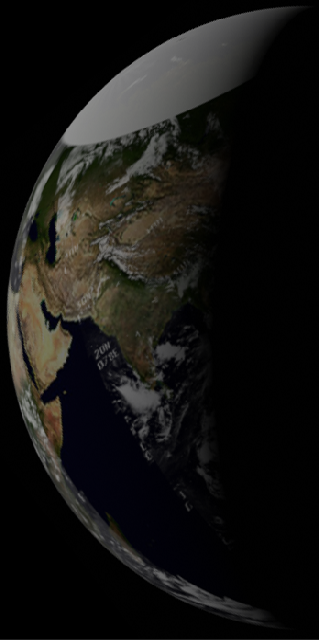
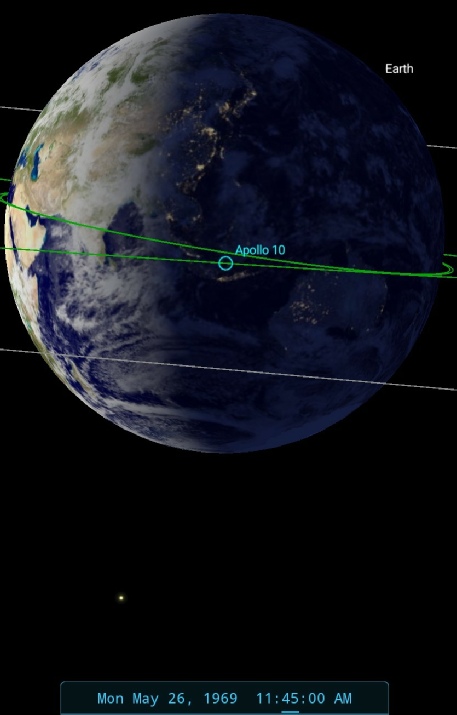
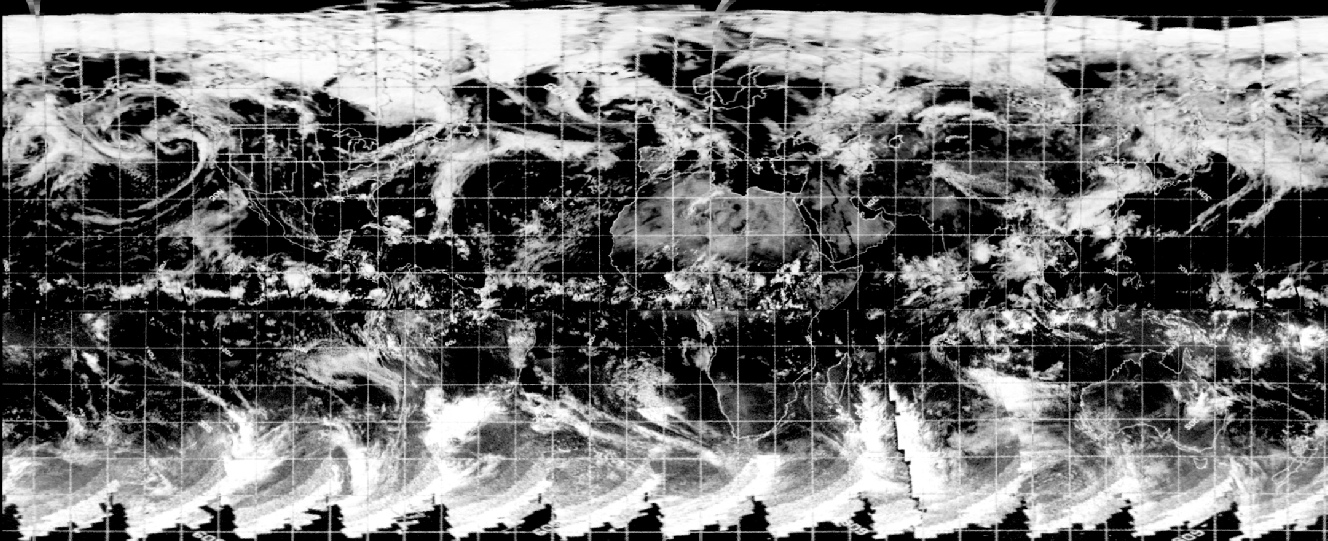
Figure 4.2.9.12: Main image ESSA 9 (left) and NIMBUS-
As with other images featuring this viewpoint, the dividing line between ESSA images makes life slightly difficult when pointing out weather systems. Those over Europe and Africa were taken at the start of the orbital cycle on the 25th, while India and Asia were imaged towards the end of the cycle on the 26th.
SkySafari suggests an image time of around 11:45 on the 26th, just a few hours short of re-
ESSA's timings for track 10, the best fit orbit for the terminator, show that orbit 1112 (track 10) was started at 09:00 on the 26th. The eastern Africa passes are covered by orbits 1113 onwards, started at 11:05 on the 26th. NIMBUS' orbit 562 covers the Indian portion of the photograph, and was started at 04:51. The infra-
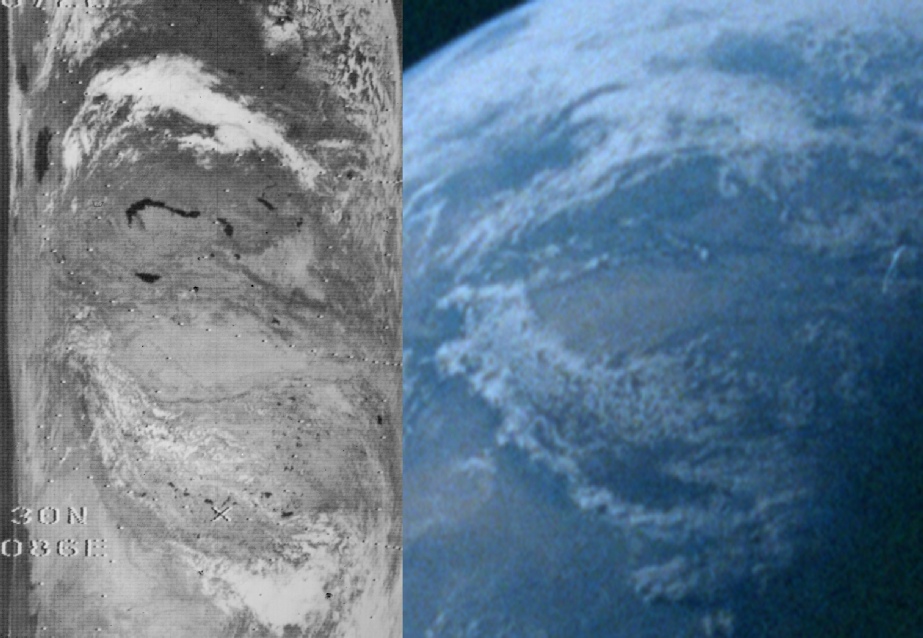
Figure 4.2.9.13: Section of NIMBUS-
As with all the photographs, and even with this time gap, there is still a good correspondence with the NIMBUS image, and an extremely good match with the other satellite images.
We also have a TV broadcast to accompany this Hasselblad photograph. This is recorded as starting at 11:40 and finishing at 11:52, and this is shown in figure 4.2.9.14.
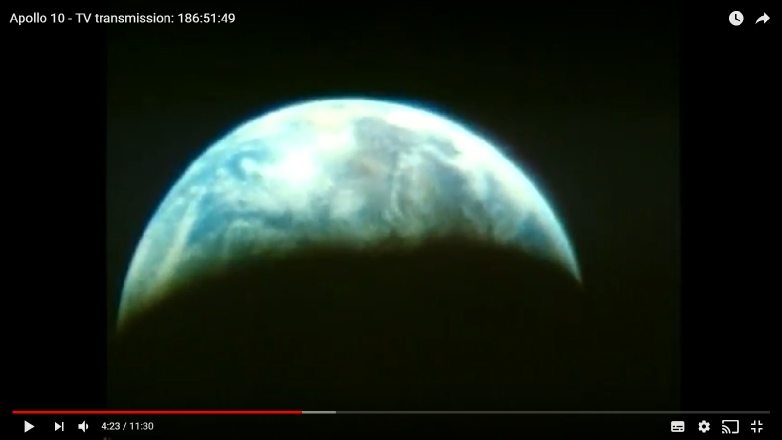
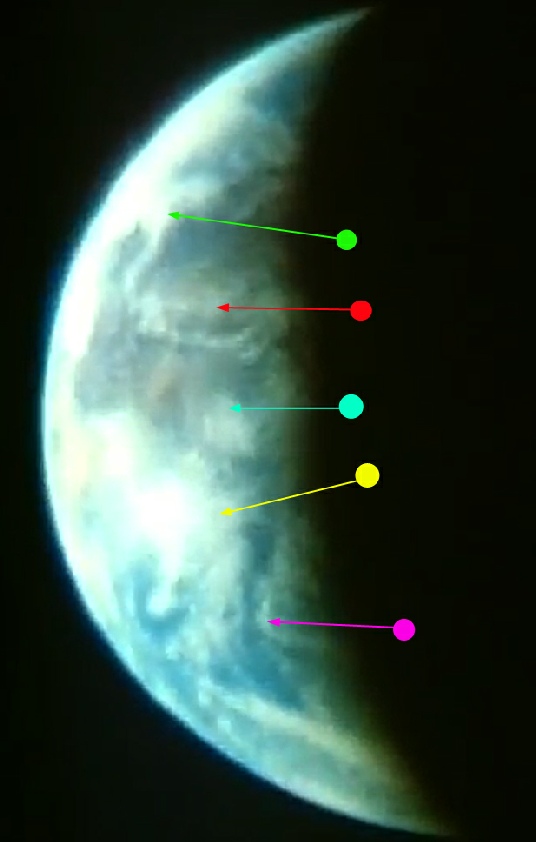
Figure 4.2.9.14: TV Still from a broadcast on May 26, 11:45. Arrows match those in 4.2.9.12
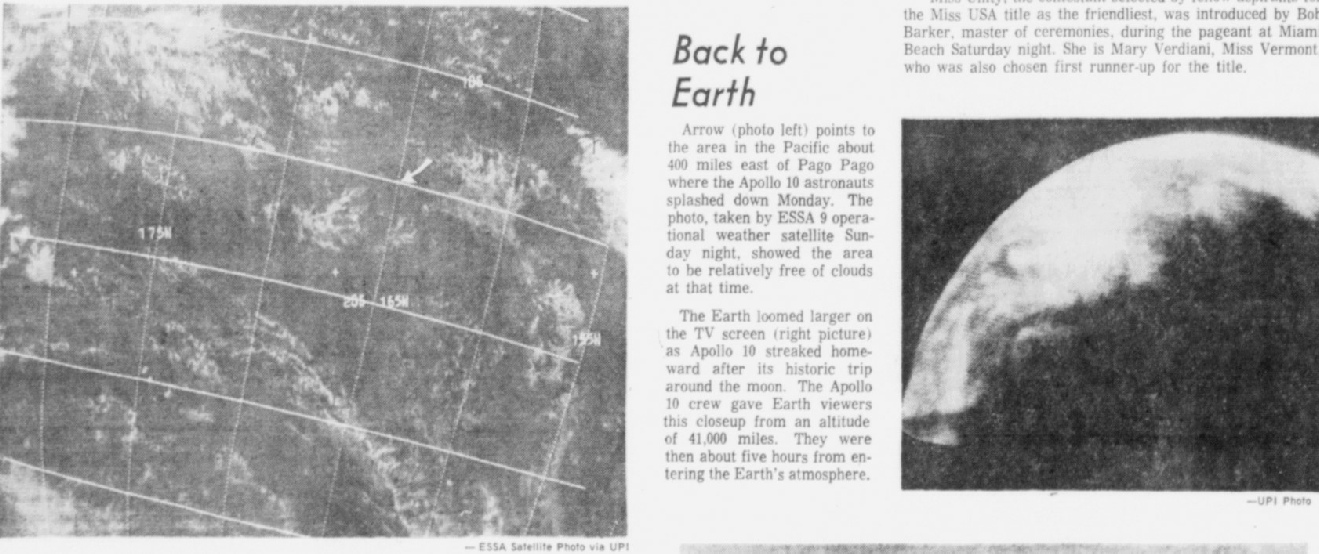
Figure 4.2.9.15: Article published in the Cedar Rapids Gazette, May 26 1969.
As always the crew describe the view
186:52:16 Stafford: ...This morning as we look out there we can see part of China, India is the most predominant feature. But also we can see Saudi Arabia, the Gulf of Oman, and the Indian Ocean at this time. And I'll try to give you a little zoom here in on Saudi Arabia and India.
186:55:05 Stafford: OK. Some final just color thoughts as we look in there. India appears to us to be a purplish tan over -
And as always they are spot on with their observations.
The maker of this youtube video takes exception to the TV view, claiming that the subsolar point shouldn’t be visible. The subsolar point is the point directly underneath the sun, but as illustrated on this page, the appearance of the that point depends on the position of the observer. Figure 4.2.9.16 shows a Celestia modelling of the view from Apollo 10’s position at the time of the broadcast.
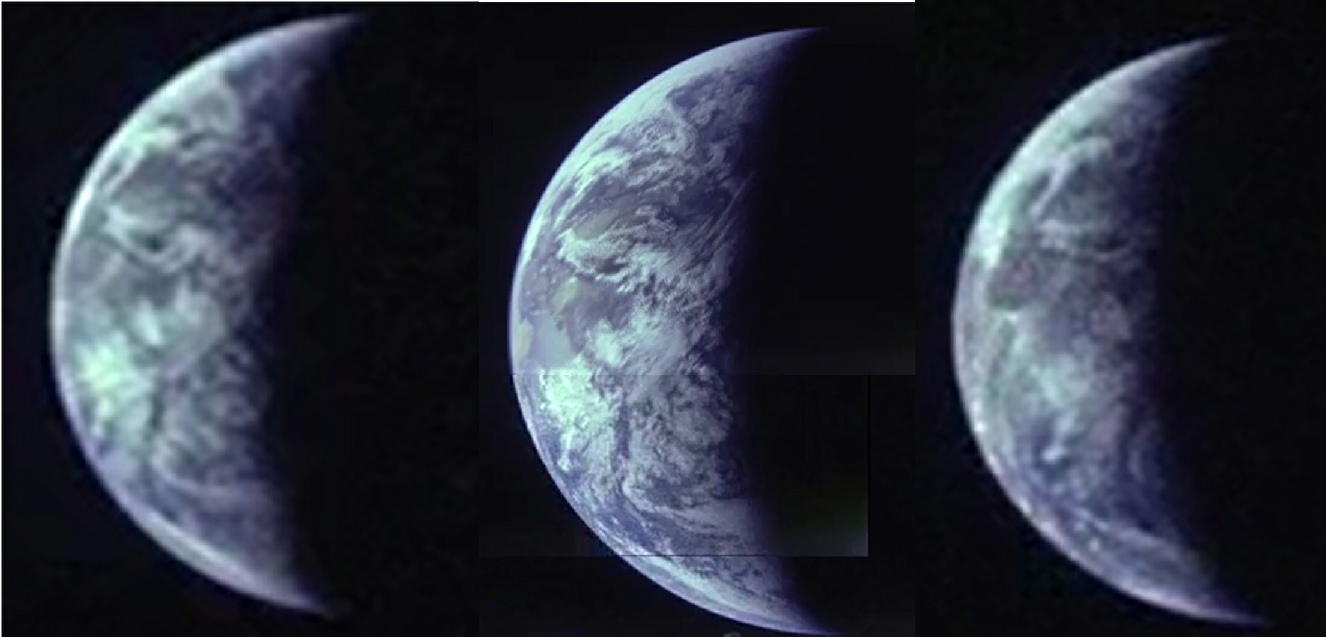
The still on the left is the first one shown in the sequence, while the composite video still is shown in the centre. There is not much between them, and it could be argued that the composite view is the same scene viewed through a better resolution zoom. There is, however, a suggestion of slight rotation between the two, particularly when looking at the northern hemisphere and the tip of the Arabia.
There is a much more obvious difference between these two and the final still, where the clouds over the eastern Himalayas have hit the terminator. This still is a much closer match to the Hasselblad image and TV broadcast, with about 90 minutes elapsing between the central pan and the final still.
As with a previous example, we have an obvious rotation of the Earth recorded on the journey home. Indeed we can state pretty categorically that the combined video and still photographs record a consistent and obvious rotation of the Earth, and the development of its weather patterns, over the course of the entire mission.
It should be an inescapable conclusion from the TV and video footage alone, showing as it does long sequences of the lunar surface not visible from Earth yet described by the crew in great detail, and long sequences of Earth filmed from great distances, demonstrates more than adequately that people filmed those views. Apollo 10's series of Earth photographs show that the astronaut's cameras took photographs of a revolving Earth with evolving weather systems over the course of the mission. The behaviour of the weather systems and Earth in those photographs are entirely consistent with the photographs having been taken in space on the way to, orbiting around, and returning from the Moon and this claim is completely vindicated by the satellite record.
Having dealt with the photographic and video evidence, it is now time to examine other supporting evidence in the form of synoptic charts.
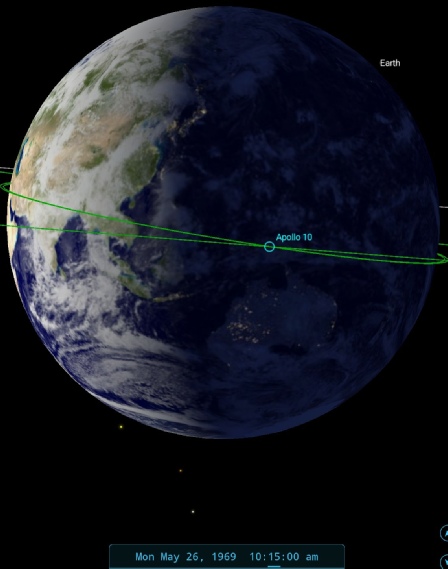
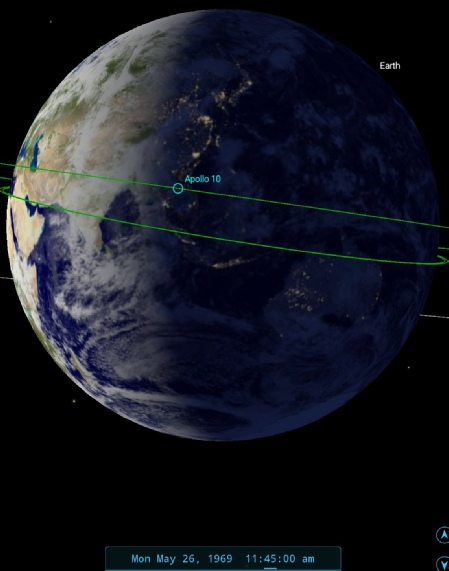
Figure 4.2.9.17: Successive 16mm observations of India with SkySafari time estimates
A TV still from that broadcast was published in the evening journal ‘Cedar Rapids Gazette’ on the same day, together with a satellite image showing the splashdown area from the previous day (figure 4.2.9.15). By the time of publication the astronauts had already splashed down.
As the figure shows, not only are the views of Earth correct geographically and meteorologically, the apparent subsolar point is in exactly the right place for Apollo 10’s position in cislunar space.
He also claims it’s just a photograph, and presents a very poor quality version of the photo he thinks it is. Sadly, he doesn’t see fit to identify the image but it appears he’s chosen a 16mm still (the one below right), nor can he account for the fact that a photo he says was taken during the mission appeared in the following day’s media as it reported the live TV broadcast.
The final set of images are all culled from 16mm observations of the same scene shown above, and they are shown below in figure 4.2.9.17. The left and right images are 16 stills, whereas the centre view is a composite from a pan across the Earth’s surface.
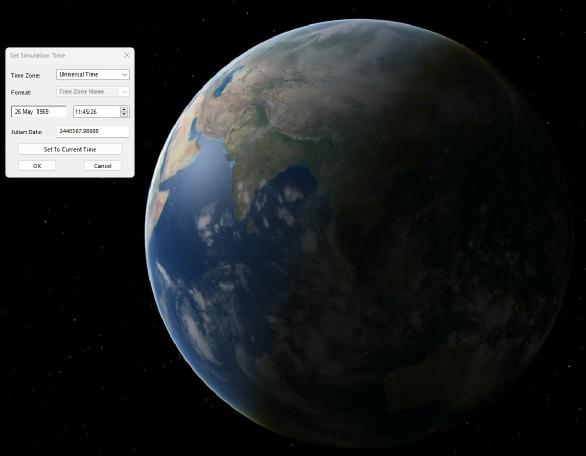
Figure 4.2.9.16: Celestia modelling of Apollo 10’s view of the apparent subsolar point.