4.9.1-
Having powered their way through sunrise Apollo 17 emerges blinking into the eternal daylight of cislunar space, Before separating from the SIV-
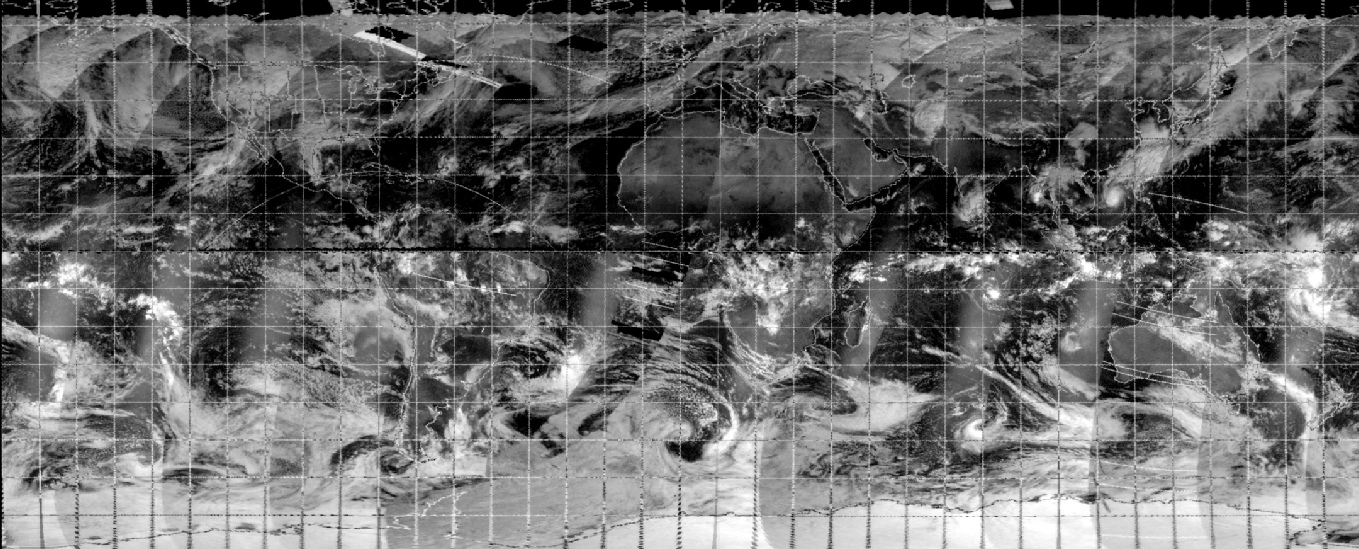
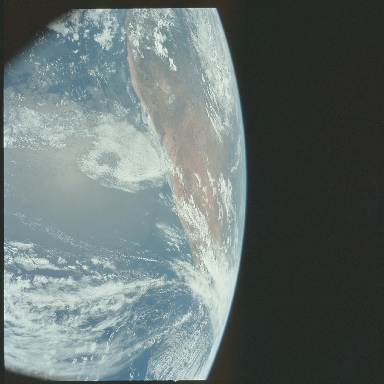
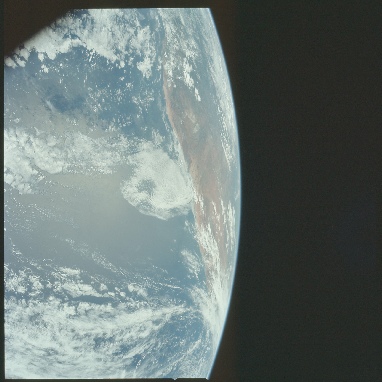
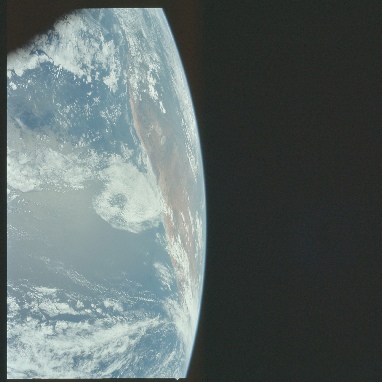
Figure 4.9.1-
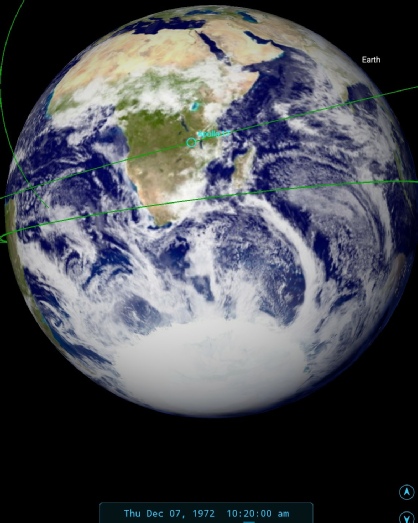
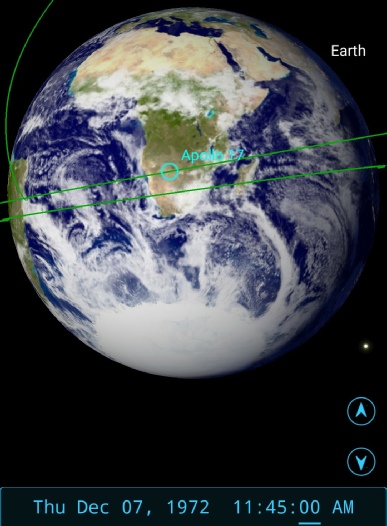
The records show that TLI (in darkness) occurred at 08:51, and as there are no clouds of debris particles we can assume it is before CSM separation at 09:15. It’s also looking in the direction of travel, so it must also be before the manoeuvre to docking attitude that was commenced at 09:06. Let’s see what a time of 09:00 gives us in terms of a view, and how that view compares with the satellite record in figure 4.9.1-
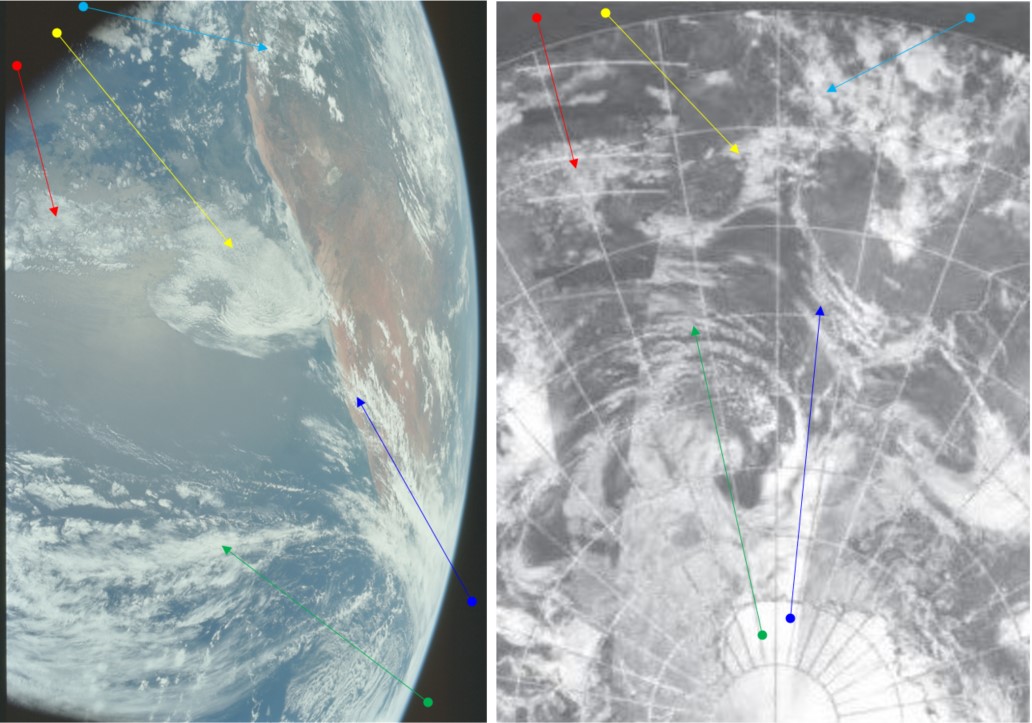
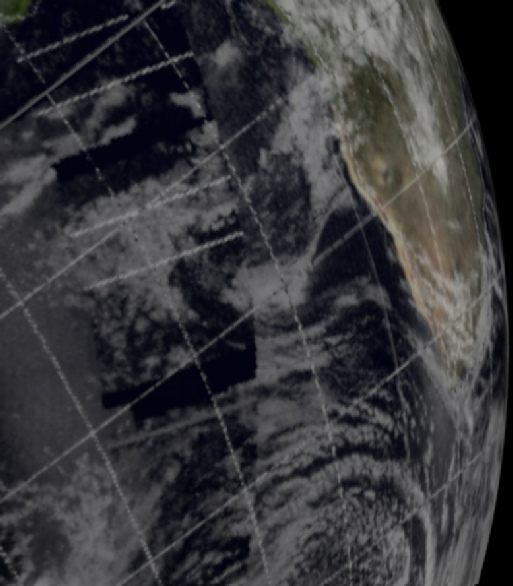
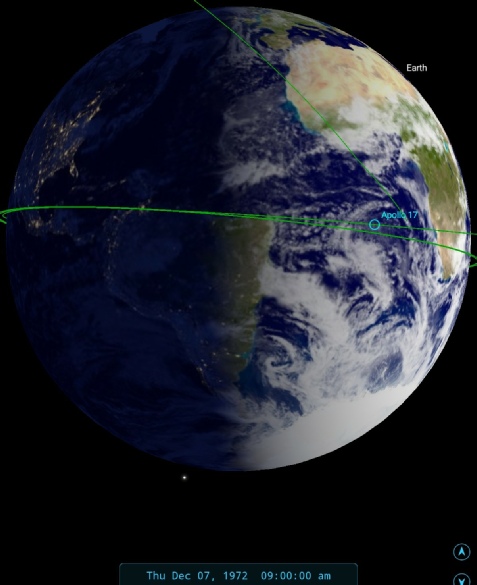
Figure 4.9.1-
Before making any kind of comment it has to be noted that the satellite image here is not without its problems -
The next section gets complicated, because a lot of photographs and other images are flying around at the same time. We’ll try and get them in some sort of order.
The general procedures for any Apollo launch are the same: launch, orbit, TLI, LM extraction. The LM's extraction and docking with the CSM was usually filmed, and sometimes as part of that filming other shots were recorded. One such shot is given in this this recording The footage features the camera rolling over the Earth's surface before it goes on to focus on the SIV-
By taking several screenshots from this footage, it is possible to see, if not a complete disk, at least a full north to south pan. This pan can be seen in figure 4.9.1-
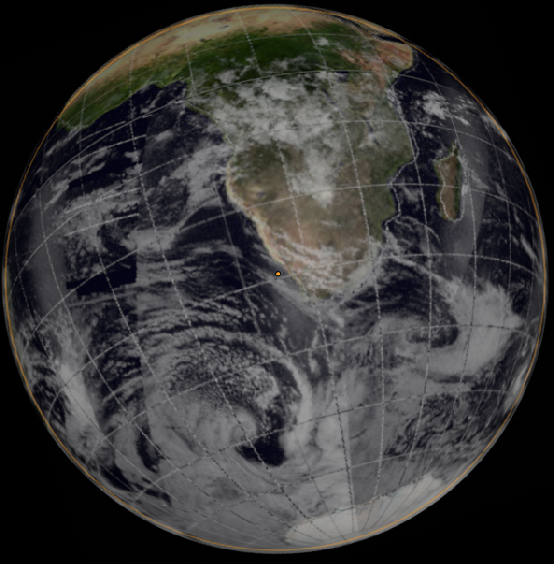
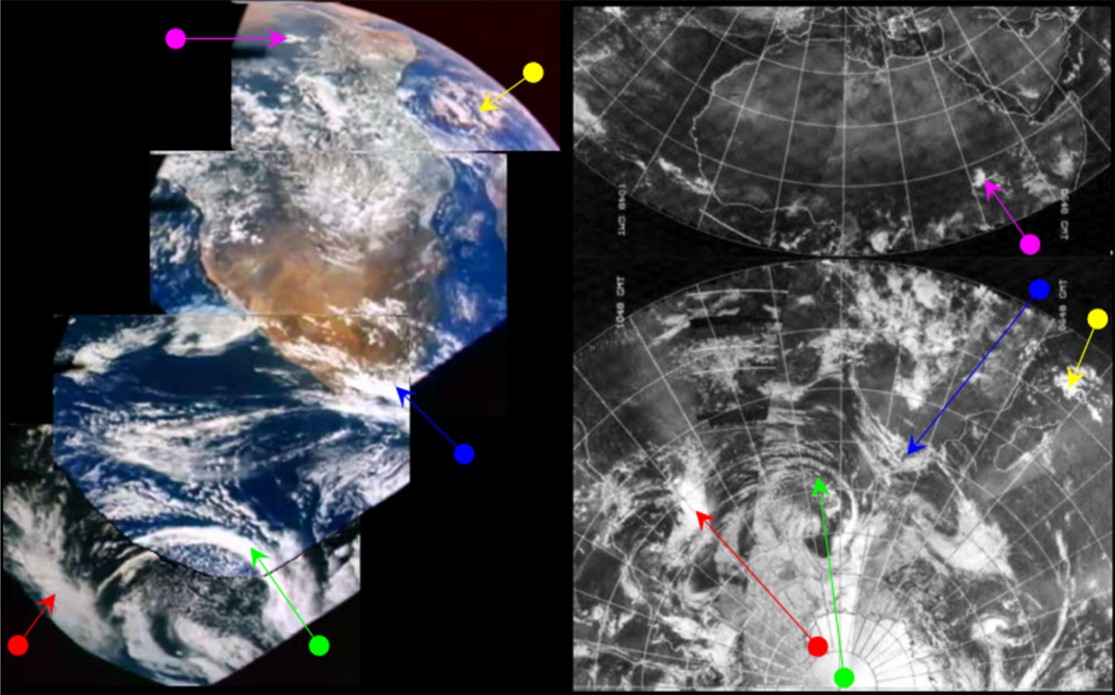
Figure 4.9.1-
Before looking at the weather patterns there, it's worth looking at the quality of the images themselves. The lower frame of the Earth image created from the video screenshots is considerably darker than the other three, and this is probably a result of the camera adjusting to the light conditions. Despite the difference, the video as a whole is still a single piece of unedited footage. The globe is completely lit, which is what would be expected from 09:15 GMT – the separation time for the SIV-
The second observation is that the NOAA image has evidently suffered some of the image stability issues discussed in preceding sections, particularly off the west African coast. This problem unfortunately obscures an extremely prominent cloud just off South Africa.
The weather system to the east of the system identified by the cyan arrow also looks to have had problems with data interpretation from the satellite image. Lines can be made out running up through southern Africa, and the angle of some of the clouds is not consistent with the overall pattern. Some of the clouds off the eastern South Africa coast, for example, seem to belong to the outer edges of the large sub-
Despite the quality issues in the satellite photo, there are still obvious features that occur in the Apollo video and in the satellite image.
The large whorl of cloud south west of the Cape is very evident, as is the finger of cloud extending from the Antarctic near the coast of South America. The broken clouds across all of southern Africa show the same distribution on both images, as does the small area of localised cloud north of Madagascar.
The time of the Apollo video has already been established at around 09:24, and NOAA's image is recorded as being 06:48 GMT for the east coast of Africa, and 10:48 for the mid-
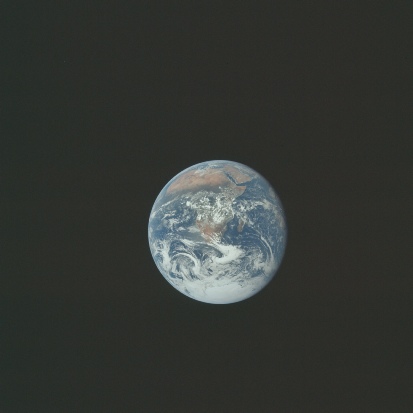
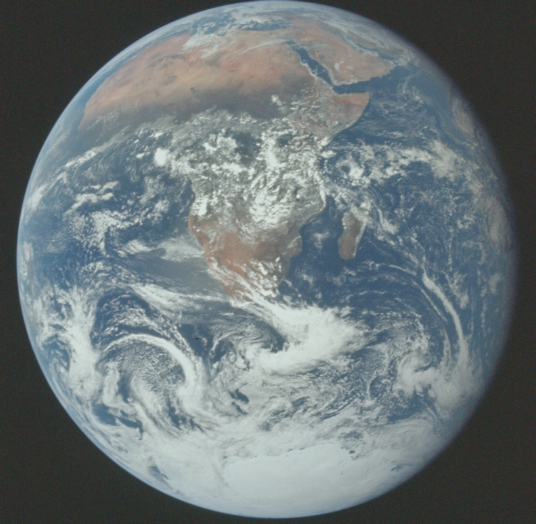
While the moving pictures were being captured, lots of still photographs were also being taken, and we have several photographs of a partial disk taken after separation (judging by the existence of lots of debris in the ones preceding the Earth photographs. They are also taken before docking, as they precede images of the docking process, which completed at 09:30. Figure 4.9.1-
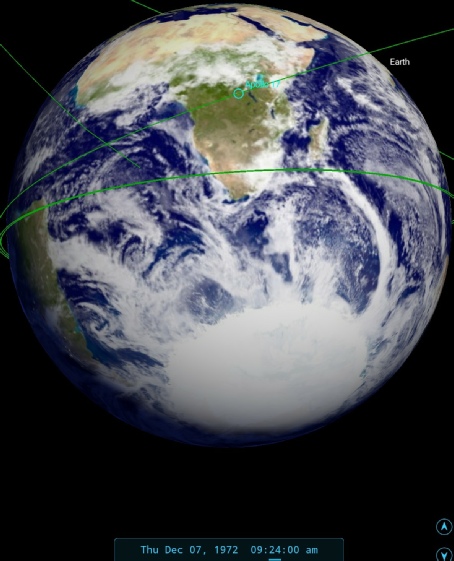
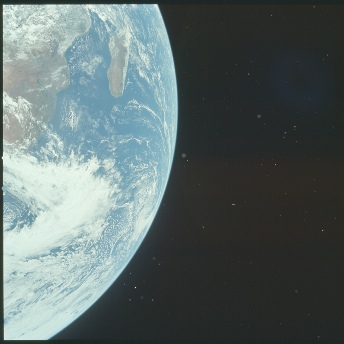
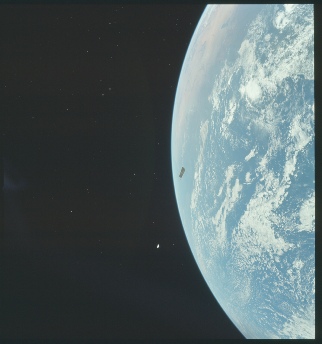
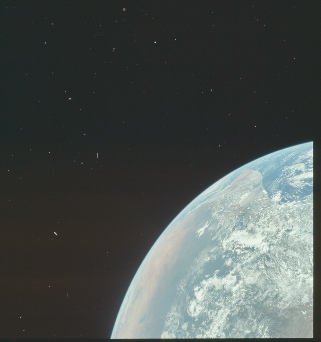
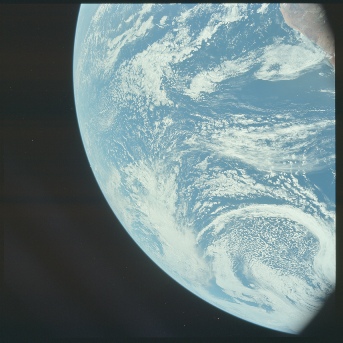
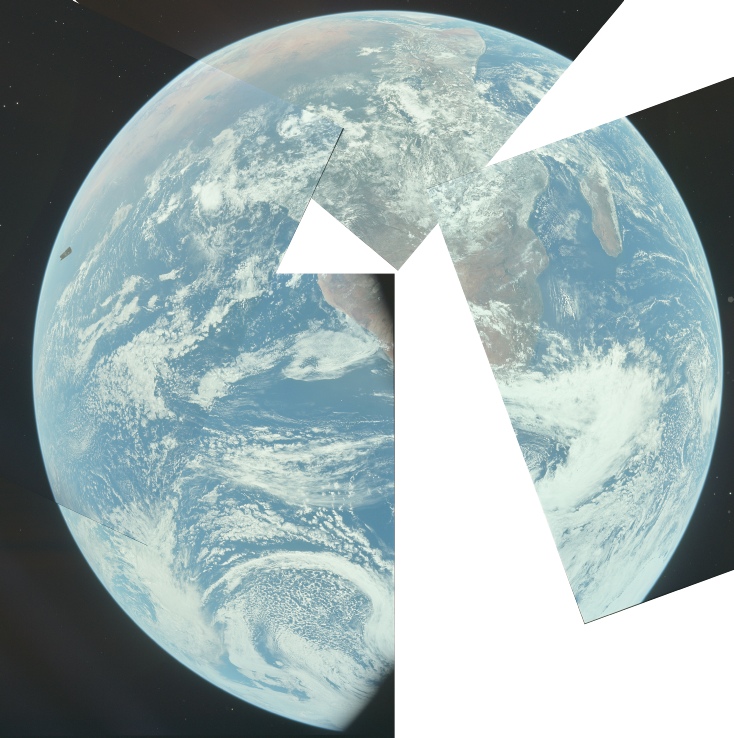
Figure 4.9.1-
It’s worth noting here that the crew are not yet far enough out to see the entire globe, hence the disproportionately large size of Africa compared with the SkySafari view in figure 4.9.1-
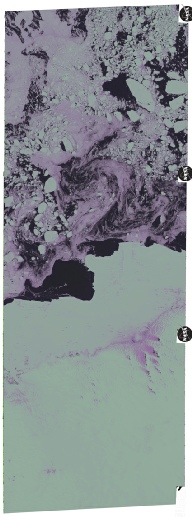
Now that we’ve introduced these photographs we can discuss another satellite that was in operation at the time: Landsat. Figure 4.9.1-
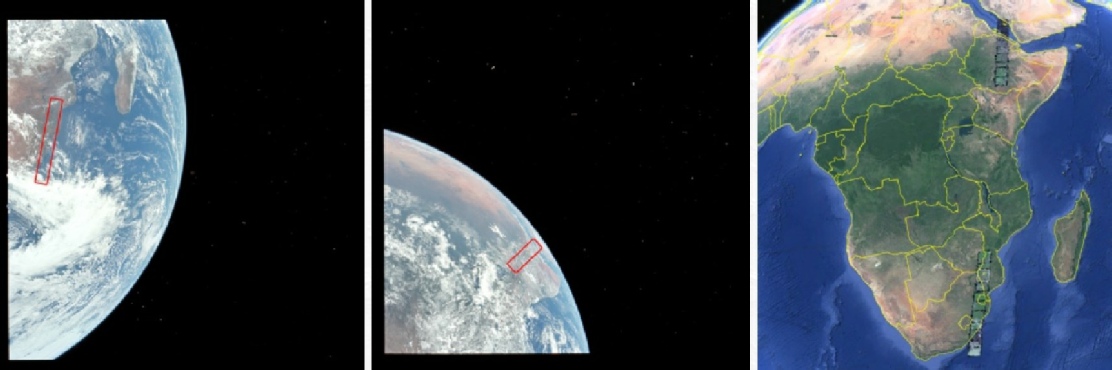
Figure 4.9.1-
The data from the Landsat images shows that they were taken between 07:00 and 08:00 on the 7th, giving only around 2-
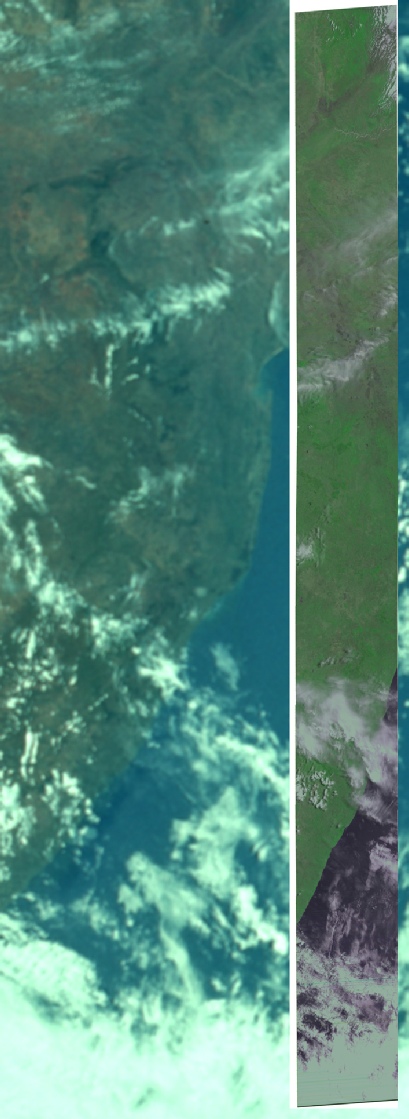
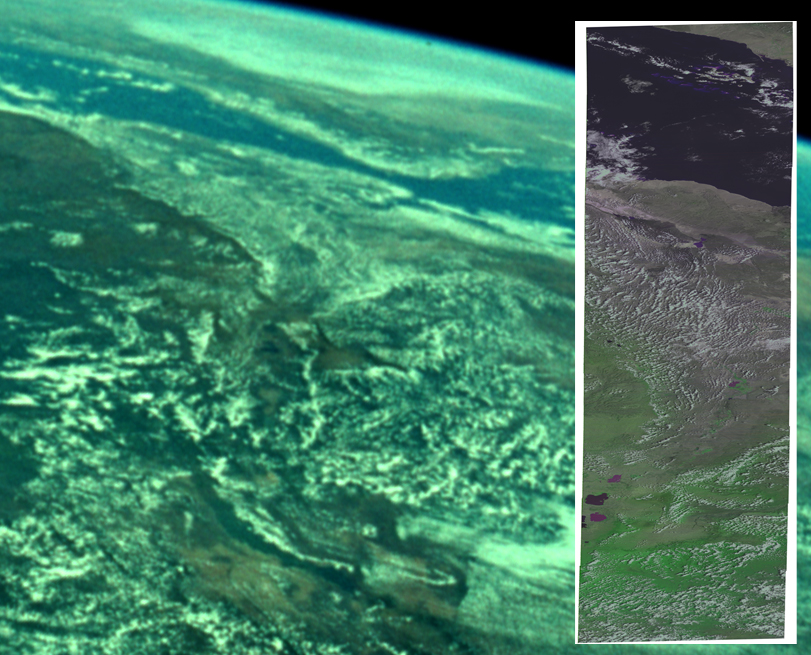
Figure 4.9.1-
Looking first at the southern Africa image, we can see a clear correspondence between the two, starting with the long thin band of cloud over the area west of Kruger National Park, to the larger mass of cloud off the South African coast. North of that larger cloud mass is the thinner offshore cloud that moves inland in the Durban area. The reader is gently nudged to the EPO section of day one for a comparison of an Earth orbit image with a Landsat tile.
In the image covering the Red Sea there is the band of cloud between Eritrea and Yemen/Saudi Arabia, as well as a patch of cloud on the edge of the Danakil desert where it meets the sea. Covering the desert area itself is a large area of broken patchy cloud that is exactly matched in the Apollo image.
Also part of this sequence are two other photographs that give us a perfect view of the two Landsat passes, namely AS17-
The next four images of Earth are two pairs of views, one showing just the top half of Africa, the other an almost entire disk, an example from each pair is shown below in figure 4.9-
Figure 4.9.1-
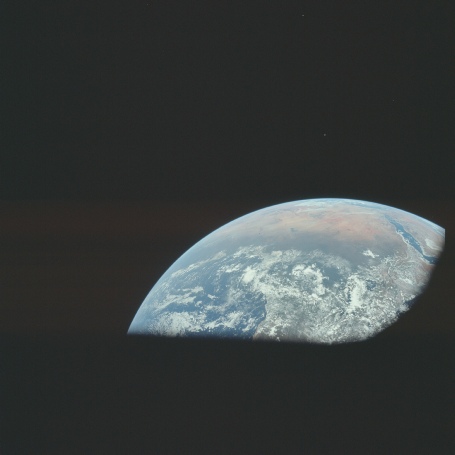
With the shot immediately before the quarter Earth being of the now docked LM, we know it can’t be before 09:30. The photographs after these 4 are of a now departing and empty SIV-
We can be pretty precise, however, thanks to the following comment in the transcript:
004:47:29 Evans: …Jack. Hand me the Hasselblad. I think we're bowing the right direction. [Pause.] Yeah, the Moon is there. The Earth is -
004:47:56 Evans: The Earth just fills up window 5…Okay, f, infinity, about a 250th, f/11.
Ron was so very close to capturing the most famous image of Earth ever taken!
The next views of Earth come as the SIV-
004:57:10 Schmitt: And for your reference, at frame 105 I started a few 250-
Which puts the time at at least 10:30 for these latest Earth photographs. Figure 4.9.1-
Notice how the proportions of Africa has changed now that Earth is considerably further away, and even parts of the Mediterranean are now visible.
The time has been set at 10:33 on the basis if the following exchange:
004:59:37 Cernan: Bob, I know -
004:59:52 Overmyer: Roger. That's a good data point. Have you gotten a good look at any of that weather down there on the Antarctic?
005:00:02 Cernan: Well, on Ron's window number 1 -
005:00:09 Evans: You know, it's real funny there in Antarctica the -
005:00:26 Evans: I don't know what to take a picture of. [Long pause.]
Very often, Ron's microphone seems to be open, allowing unusual sounds to be heard on the air/ground circuit. Earlier, the sound of the DAC movie camera was apparent. During this pause in Ron's speech, a Hasselblad camera can be heard to operate twice, including the sound of the electric motor drive advancing the film and recocking the shutter.
005:01:12 Evans: I can't see the U.S. at all.
So here we have evidence that photographs are being taken, and we also know that the evasive manoeuvre burn has yet to occur, thanks to this:
005:03:11 Overmyer: 17, Houston. It's about 30 seconds from the evasive maneuver burn.
Which gives us the time I’ve chosen.
Now that more of the Earth is visible, we also have the opportunity to look at some more Landsat views, seen in the higher resolution March to the Moon views of AS17-
.
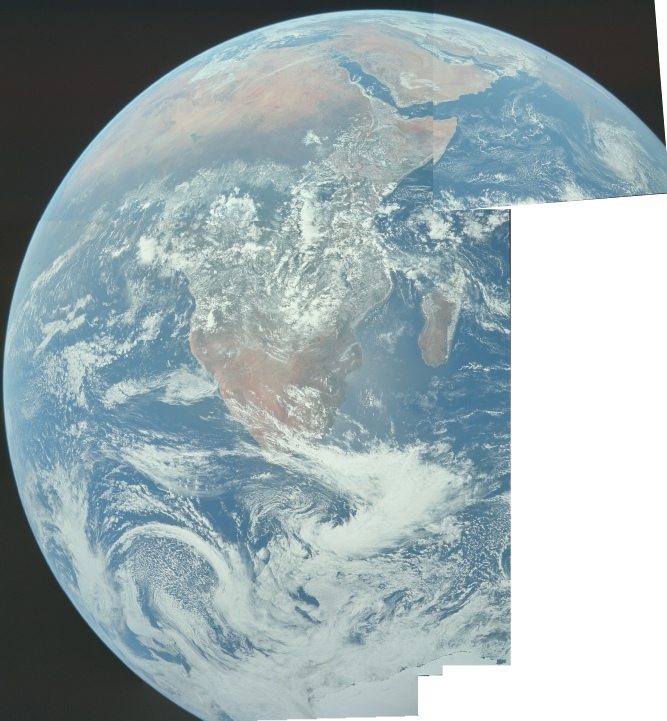
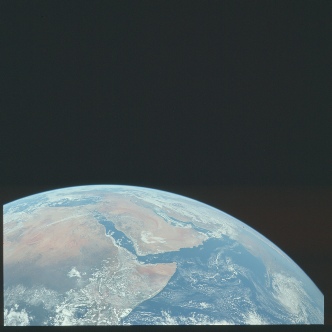
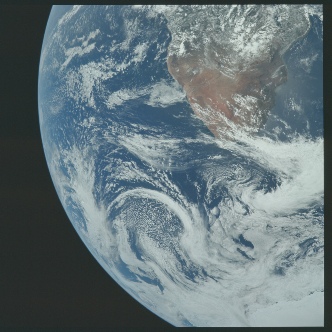
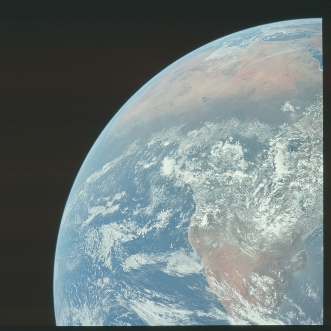
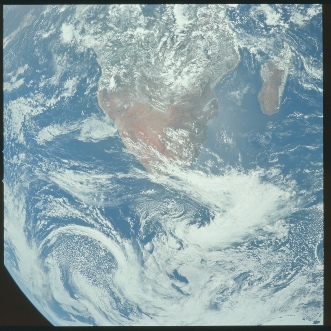
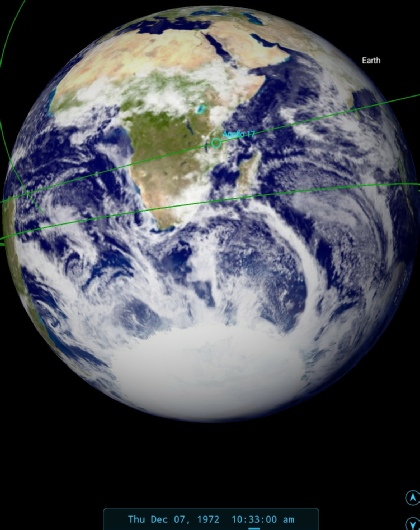
Figure 4.9.1-
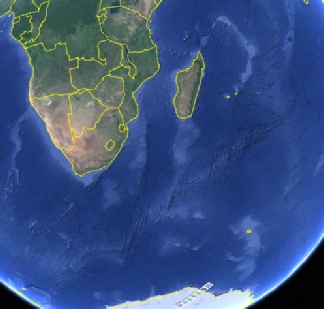
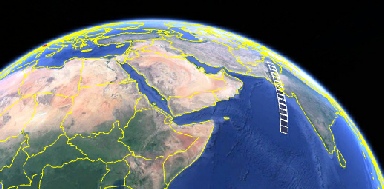
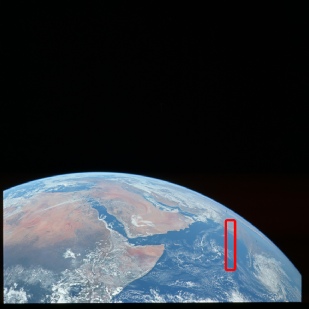
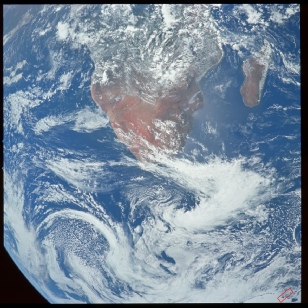
Figure 4.9.1-
Having identified where the image paths are, we can now compare them with the Landsat images themselves in figure 4.9.1-
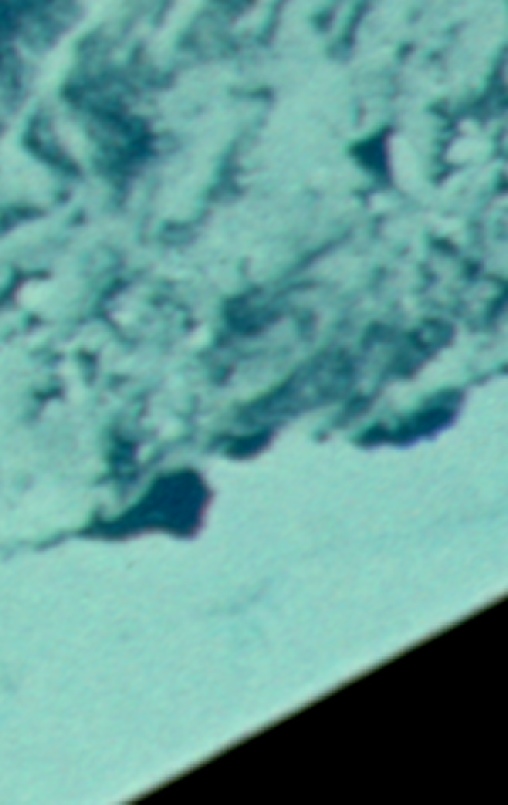
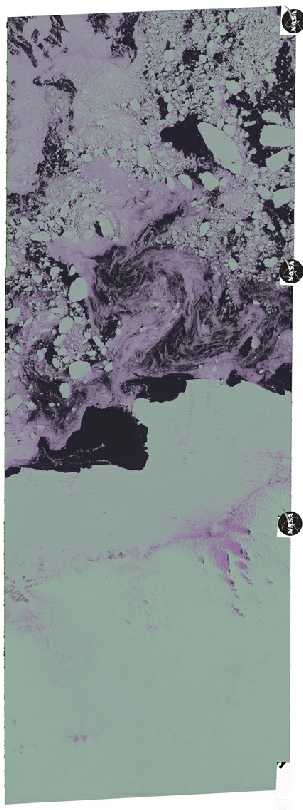
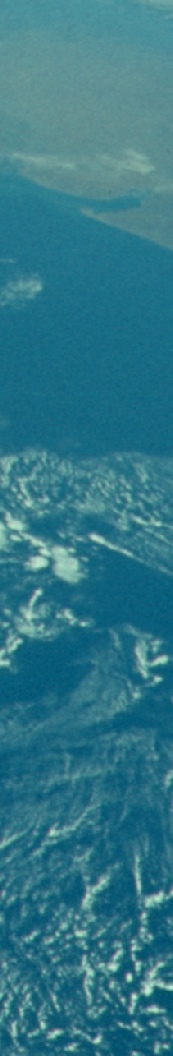
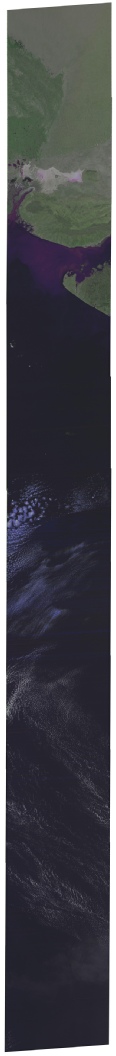
Figure 4.9.1-
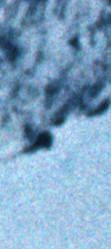
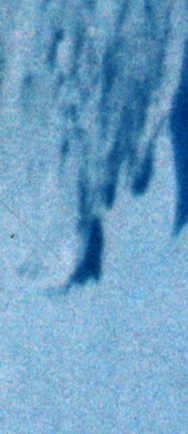
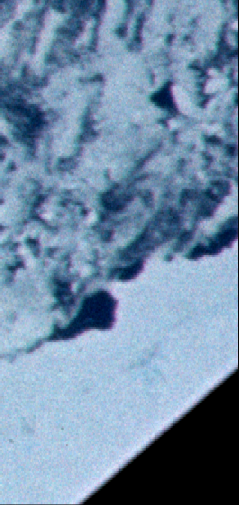
The correspondence between the two sets of photographs is absolutely spot on. The pass over the Indian ocean shows clear blue water between the coast and the wispy clouds to the south, matched exactly by the Apollo photograph. The Antarctica image is interesting because here we are not looking to match cloud formations but ice. The Antarctic ice regime is a constantly shifting pattern of bergs and open water as the coastal ice shelf breaks up in the Antarctic summer. Here we can very easily identify the clear water of the Mawson coast north of the Framnes mountains either side of a headland. It is very obviously the same area of coastline photographed by Apollo and by Landsat. And every single contour of ice and sea can be made out exactly, even down to the markings inland away from the coastal shelf. Oh, and in case anyone wants to claim these images are modern and weren’t public arena before the digital age, they’re wrong -
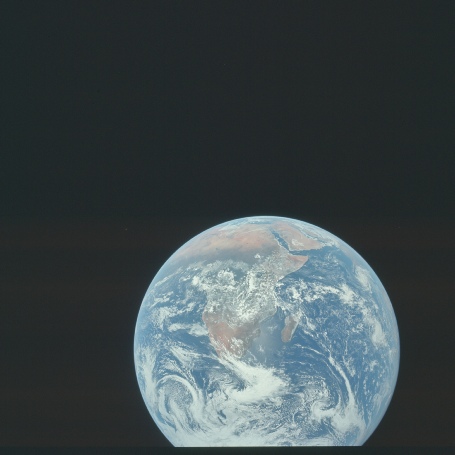
Next up for analysis is one of the most iconic Apollo images. Actually part of a sequence of Earth photographs, the so called 'Blue Marble' image has been reproduced many times. Students of a certain age (and I am one) undertaking geography studies will remember being asked to identify the various weather system components on the image as part of exam questions. Mine was in 1980, just 8 years after the mission.
Apart from the fact that it is of stunning quality, it also shows the Antarctic region in much more detail than is the norm for Apollo photographs, thanks to the trajectory the CSM was given. The Antarctic is also not a region shown in any great detail on any satellite images – at least not those used in this research, thanks to either the orientation of the geostationary satellites or the techniques used in assembling the geosynchronous mosaics.
Next up is the money shot: The Blue Marble.
Of the many versions of the photograph that could have been chosen, the one used here is AS17-
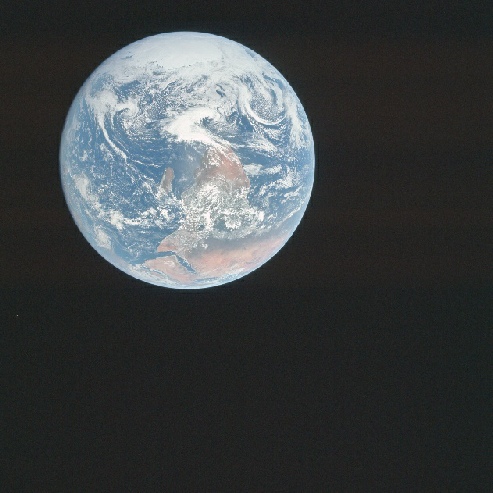
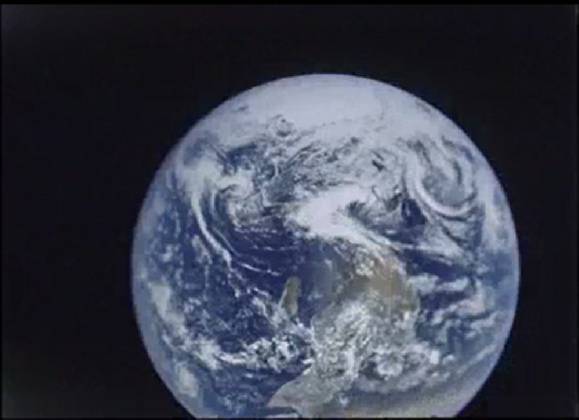
Figure 4.9.1-
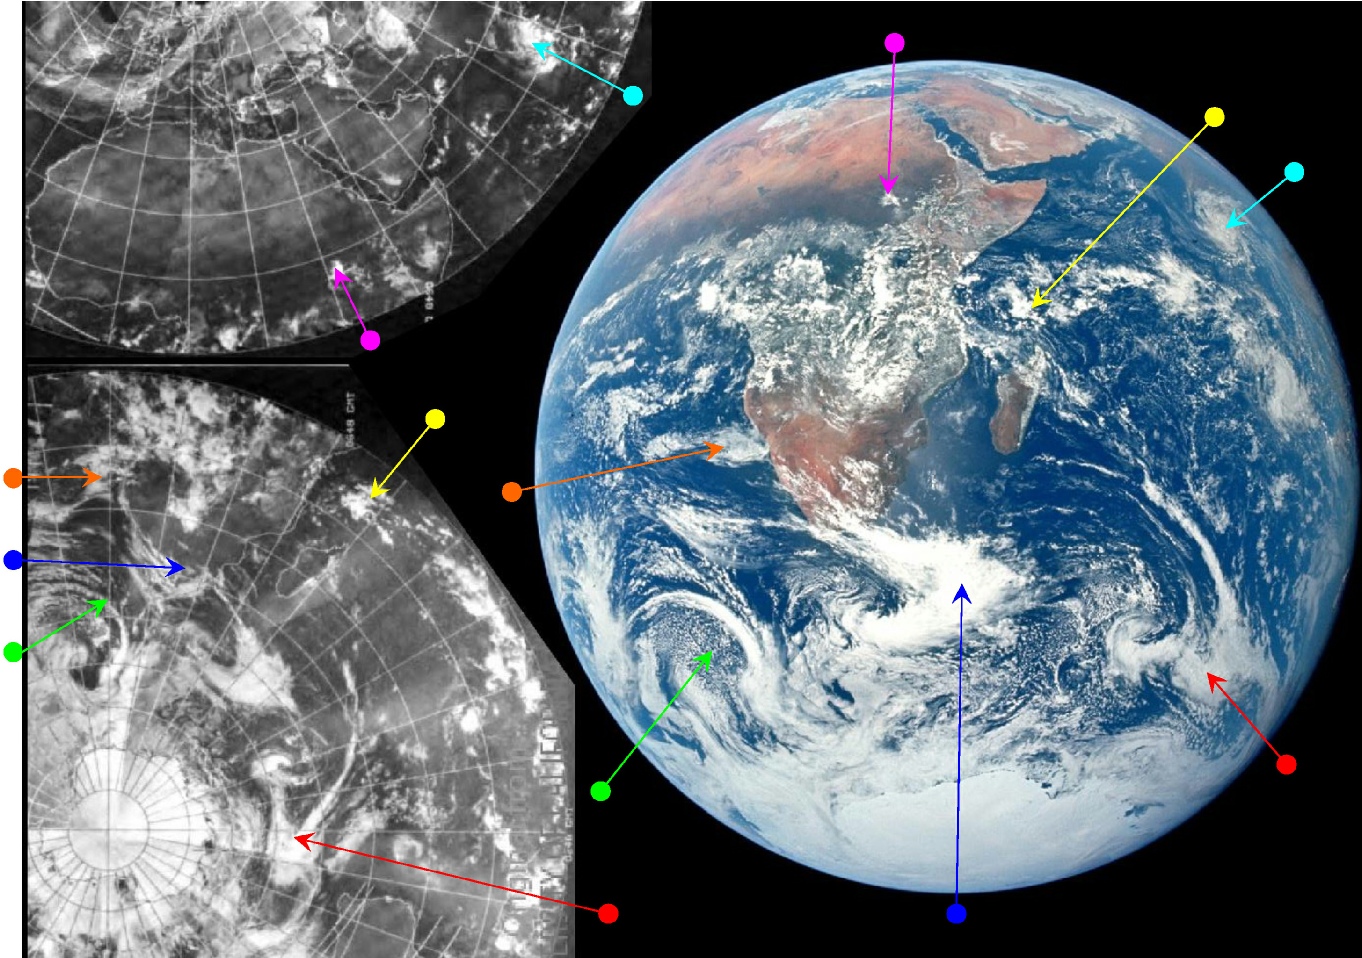
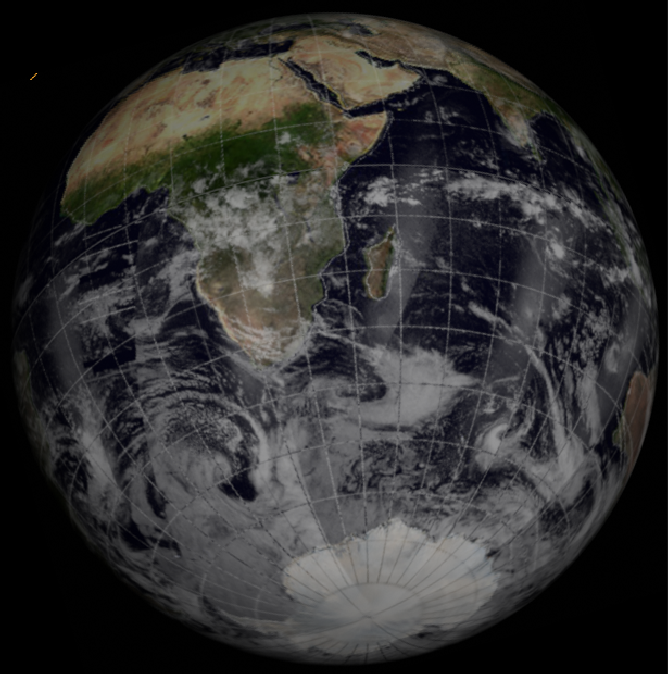

Figure 4.9.1-
I’ve added a blue line here to outline roughly what is visible in the image -
Of the cloud systems picked out, one is worth mentioning in particular as it is often referred to in articles about this image, and that is the compact swirl of cloud over southern India, identified by the cyan arrow. This swirl is in fact a cyclone that started on the 1st of December and lasted until the 8th, causing 80 deaths and considerable damage in the state Tamil Nadu. The storm, also known as the Cuddalore cyclone, is described in detail in this 1974 article in the Indian Journal of Meteorology and Geophysics. It developed from December 1st onwards, and a satellite view from the article taken on the 6th is shown in figure 4.9.1-
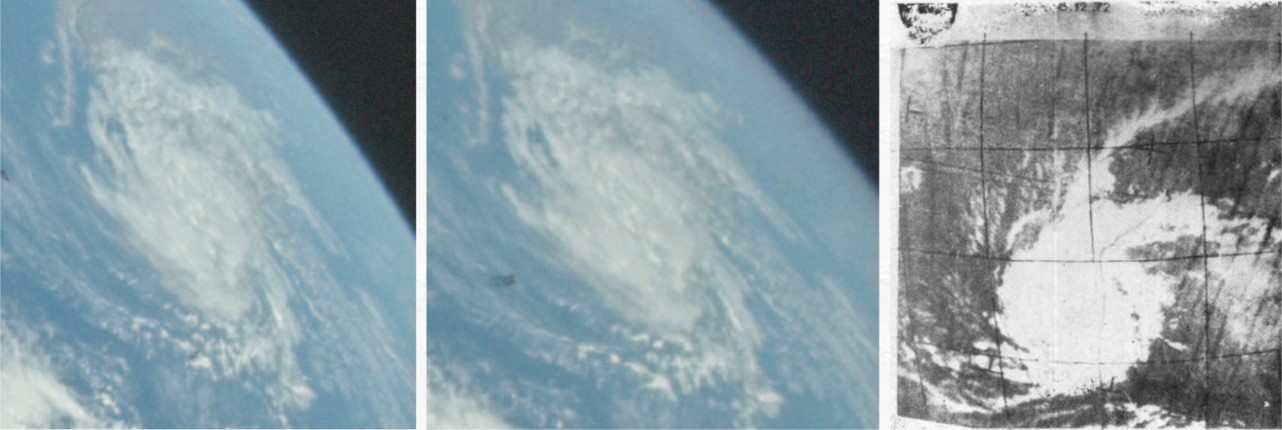
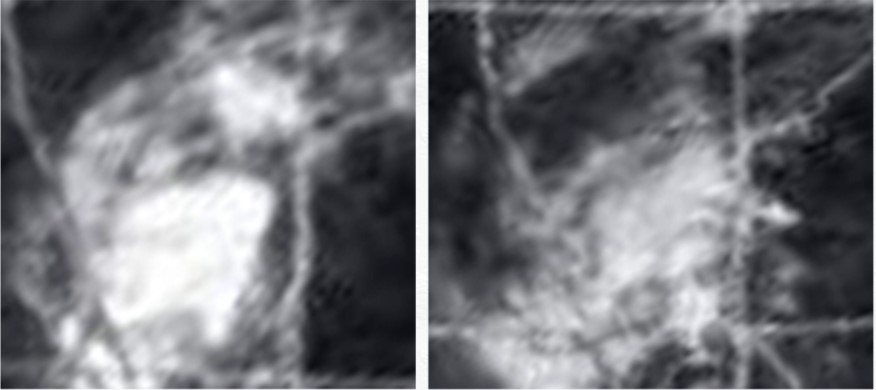
Figure 4.9.1-
The satellite view is recorded as 10:15 Indian Standard Time, which is equivalent to 04:45 GMT, Despite being taken just over 24 hours prior to the Apollo image the storm structure and location is an extremely good match. It’s also possible to make out subtle differences between the two Apollo images, reflecting the fact that they were taken an hour or so apart. The research paper identifies the images as being from ESSA-
One of the data sources for that paper is a report on how a newly installed (and only partially operational) radar station in Chennai (then known as Madras) monitored the storm as it made landfall. The report (a copy of which was kindly supplied by India’s Meteorology Service because it is not available online) has more radar images, and those from the 6th are shown in figure 4.9.1-
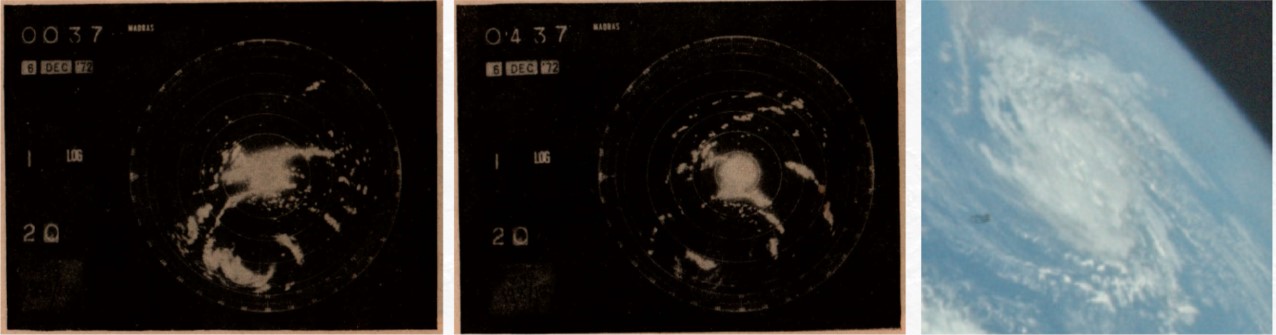
Figure 4.9.1-
It’s worth remembering that these are radar images from a system still being installed at the time of the storm, and that the images are from the day before the Apollo photograph was taken, but their significance is two fold. Firstly, they show a storm exactly where Apollo photographed it. Secondly, they show a storm that was being monitored by Indian weather services independently of any outside agency, and it was a storm for which they had comparative data in the form of weather satellite images. At no point has anyone from those weather services come out and said “hang on, these aren’t right…”. Why? Because the Apollo photograph is genuine and as such shows a true reflection of the data collected about it.
Other reports also give details of the storm, for example this one, which describes its meteorology in detail, including its track over the sub-
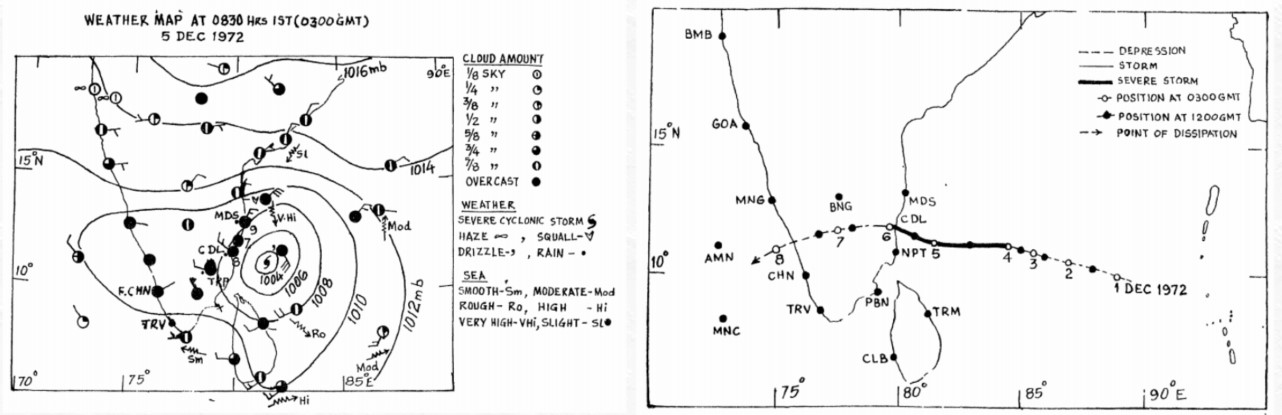
Figure 4.9.1-
The same report also has this to say about infra-
"Various stages of the development and dissipation of severe cyclone between 2 and 11 December 1972 are clearly seen in the Infrared satellite images at 21:00 IST from [NOAA data]"
and
"the infra-
The source of those images is this book, published in 1977 along with a detailed account of the storm, and a copy of which I own. Figure 4.9.1-
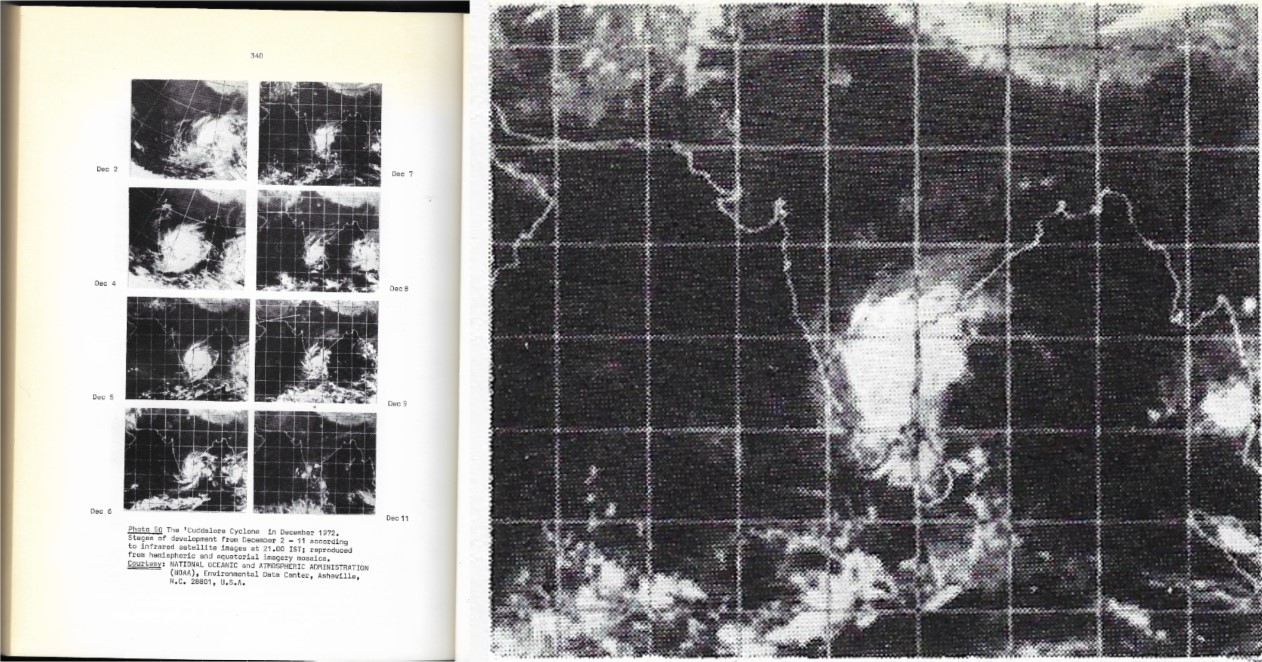
Figure 4.9.1-
The images are recorded as being taken at 21:00 IST, which is 5.5 hours ahead of GMT, putting them at 15:30 GMT. This would put the December 7th satellite image as taken some 5 hours after the Blue Marble (even less for the earlier partial Earth shot showing the storm). Despite the satellite being infra-
Again, we have freely available satellite records used in an academic volume bearing no relation to Apollo or NASA confirming details in the Apollo photograph.
Returning to the Blue Marble analysis, the time frame for the NOAA image is obviously still the same (though we do now have a likely time of 04:45 on the 7th GMT for the area covering India), and while there is no terminator visible we can estimate the time based on what is visible. SkySafari's view of the Earth at 10:45 GMT seems reasonable and is consistent with the timeline, as by this time the LM docking procedure was complete and the SIV-
Now that we have the full Earth in view, another comparison possible is of the Apollo still and 16mm images. The two are taken around 90 minutes apart, and if the viewpoint was from a stationary point above the Earth there would be no change in the landmass visible. If it was from a geosynchronous orbit, more of the south American continent would be visible as these go against the rotation of the planet. Instead (this is more obvious in the full size stills), we have more of Asia visible in the later still photograph, which indicates a movement both with and faster than the rotation of the Earth as it travels away from it – launches were in fact arranged that way to capitalise on the momentum this rotation gave the Saturn V.
In comparing this Apollo image with NOAA's mosaic the image chosen has been that dated the 7th of December. However, the bulk of the Apollo image shows land and ocean that would actually have been imaged on the mosaic dated the 6th. With this in mind, figure 4.9.1-
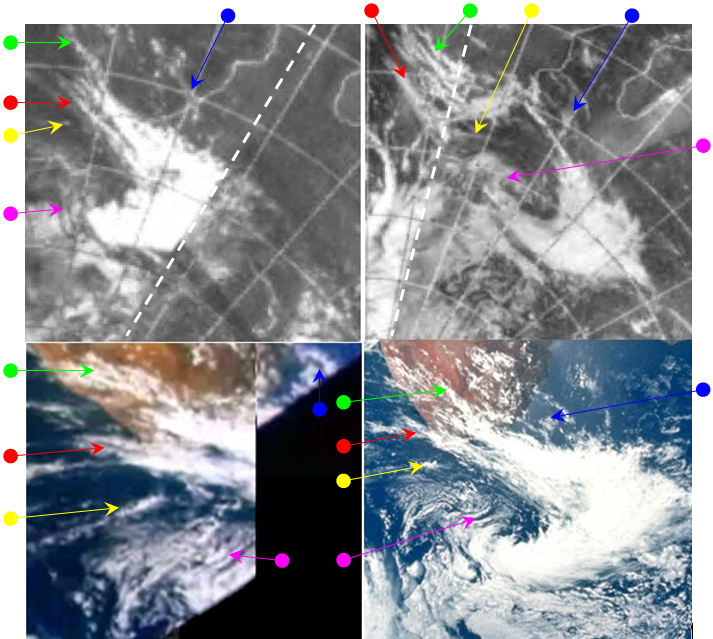
Figure 4.9.1-
As far as the weather systems are concerned, they are clearly the same overall, but as with other examples in other sections, there are subtle differences accounted for by the time gap between them and not accounted for by the slight difference in perspective. The blue arrowed clouds are further east in the later picture, as is the green arrowed one, which has also merged with an onshore cloud mass. The red arrow points to clouds that have also joined another, more easterly, cloud mass later on. The yellow arrowed clouds have apparently moved little but the clouds either side of them have changed their relative positions. The magenta arrows pick out adjacent strips of cloud that have closed the gap between them.
In going over this small area in fine detail it is possible to find many differences that demonstrate that they are not simply the same photograph treated. It should also be obvious that they do not match the satellite images exactly. The key point here is the comparison with the clouds as they appear over (and to the west of) South Africa, which are imaged at the start of the satellite's day, and those to the east of South Africa, which were imaged nearly 24 hours later. Despite issues with data quality for the 7th, it should be obvious that the cloud mass over the Cape bears a much better resemblance to the NOAA image from the 7th rather than the 6th.
East of the Cape and it starts to become more difficult. A closer look at the full size image shows that the edge of the large white cloud mass ends more or less on a line of longitude just east of Madagascar, while on the image dated the 7th it ends much further to the east. The blue arrow is relatively easy to place, but the yellow and magenta ones are much trickier to locate precisely. It is suggested here that the dashed lines on the NOAA-
Does this mean the satellite images aren't genuine? No, they are as good as they can be given the technology of the time they were produced, and anyone who denies that the clouds you can see in them aren't reflected in the Apollo images needs their lenses checking, they clearly are the same. Does this prove that the Apollo images aren't genuine? No, but it does make it more difficult for people to claim that they are simply faked directly from satellite photographs!
Perhaps the best possible confirmations of the weather from space come from the astronauts themselves. The crew (usually Jack Schmitt) give possibly the longest sequence of descriptions of the Earth's appearance of all the missions, with only the occasional interruption from Capcom with mission related technical information. The conversation starts at 10:48 GMT:
005:17:54 Cernan: Bob, you've got a pretty good size storm over the north -
This is evidently the tropical storm discussed earlier. A few minutes later at 10:51 GMT, there is this contribution:
005:19:00 Cernan: Bob, Antarctica is what I would call effectively just a solid white cap down on the -
005:19:45 Overmyer: Roger.
005:19:46 Cernan: The continent -
And again a few moments later:
005:21:27 Cernan: Okay. And I suppose we're seeing as 100 per cent full Earth as we'll ever see; certainly as I've ever seen. It appears to be -
005:22:59 Cernan: Bob, it's these kind of views -
005:23:07 Overmyer: Roger, Gene.
005:23:09 Cernan: We've got a -
005:24:59 Overmyer: Roger. We understand.
005:25:02 Cernan: And there's one batch of clouds in northern Africa, just a small batch, it looks like it may be up near the -
At 11:02 Schmitt takes over the commentary:
005:30:06 Schmitt: Bob, I'm looking over Gene's shoulder here at the Earth, and it must be an awful clear day for the so-
005:30:07 Overmyer: Roger.
005:30:08 Schmitt: Looks like a major circulation system off the southern tip of Africa, as Gene mentioned, plus one west of that, 20 or 30 degrees of longitude. Make that east of that.
005:30:09 Overmyer: Roger.
005:30:10 Schmitt: And, southwest of the -
005:30:11 Overmyer: Roger, Jack.
005:33:50 Schmitt: But I would guess that South Africa is going to have good weather for several more days, at least. And if the pattern is -
005:33:51 Overmyer: Roger. Understand.
005:33:52 Schmitt: As we were going -
There are another couple of pages of this, including confirmation they had been taking photographs of the view, and it should be evident that they are describing what is in the photograph, and that there is no way they would have known this other than seeing if for themselves, as the satellite evidence would be unavailable for several hours yet. Perhaps most significant is this:
005:54:25 Schmitt: Okay. [Pause.] There is a good strong northern hemisphere cyclone up near India, and I think Gene mentioned that. It, I think, was one I saw in some of the forecast sheets as a dissipating hurricane or typhoon. I'm not sure which it is there. I guess it's a typhoon. [Pause.] And I see something here that I noticed in Earth orbit, Bob. That as you approach the terminator -
Obviously discussing the Cuddalore cyclone.
Shortly after the first blue marble sequence, we have a sequence of four photographs that appear superficially similar, but where close examination suggests a time gap between them and the first round of photographs. Figure 4.9.1-
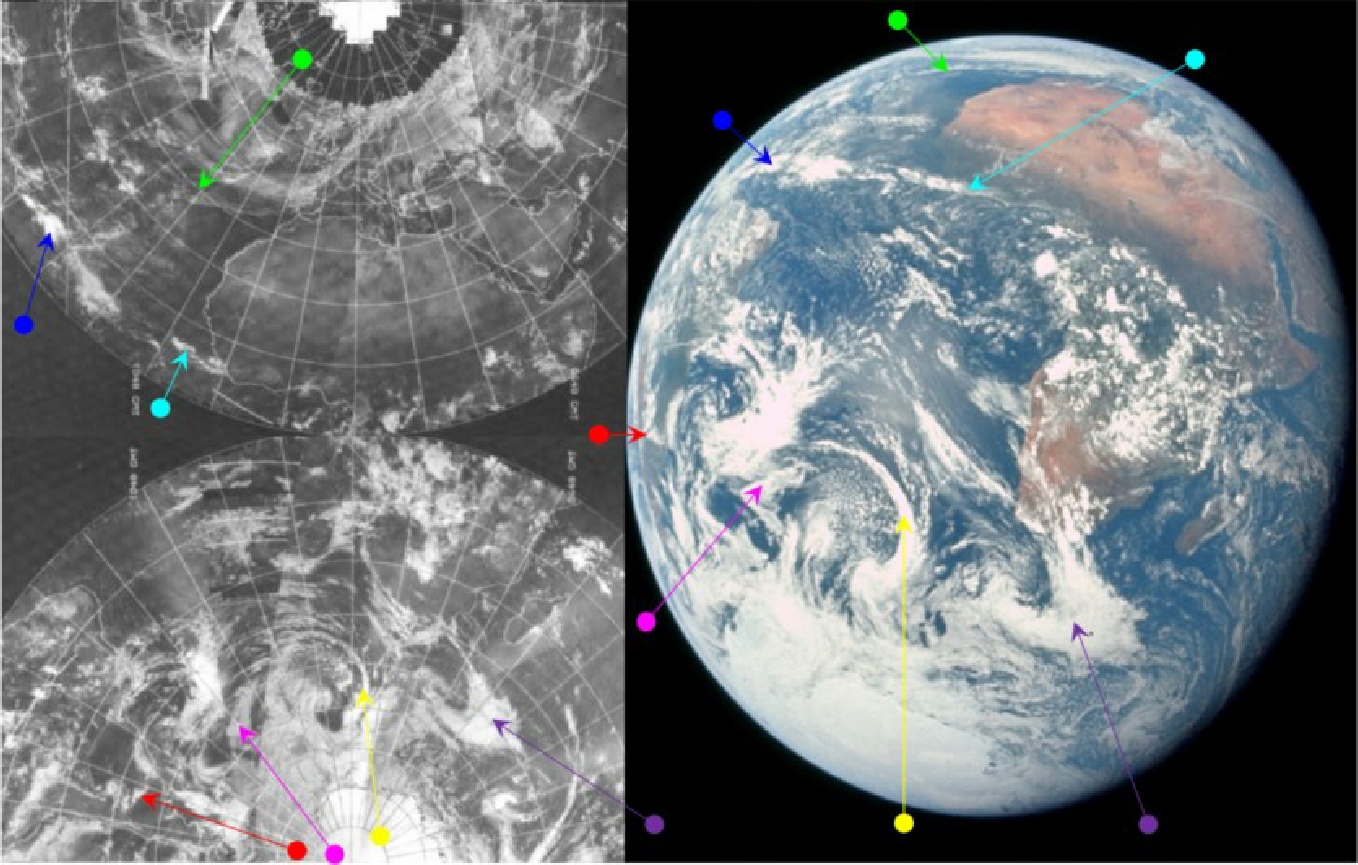
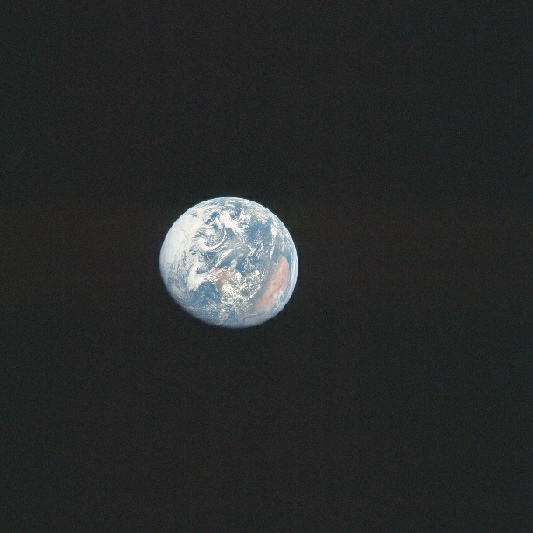
Figure 4.9.1-

Figure 4.9.1-
The hours covered by these photographs would normally be enough to change cloud patterns recognisably (and if you look carefully at the other areas of the photographs clearly has been), but less so with the ice flows. The only differences readily apparent here are accounted for mostly by viewing angle and focus, focus that becomes less sharp as the subject becomes more distant. The clearest image is obviously AS17-
Just in case anyone thinks it’s all a bit convenient that these Landsat images are around digitally, well, they’ve been public a long time -
That’s it in terms of photographs, but they are still admiring the view back home. At around 20:45 we have this exchange:
015:09:44 Cernan: Yeah, from the looks of things, Bob, down there, it looks like getting off last night was a good idea.
015:09:55 Fullerton: Got a new CapCom now, Geno. Why? Looks kind of cloudy down there?
015:10:01 Cernan: Yeah. Hello, Gordo. How you doing? Yeah, I'm looking -
015:10:43 Fullerton: Roger. I can verify the part between the Cape and Houston, anyway. [Pause.]
015:10:57 Cernan: Yeah, the Gulf looks like it's pretty well filled with clouds. Looks pretty thick from here.
015:11:03 Fullerton: Roger.
015:11:07 Cernan: However, if you're interested in going to South America, the whole continent looks -
Figure 4.9.2-
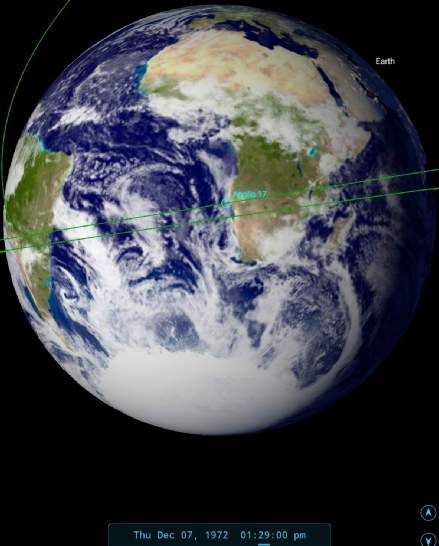
Figure 4.9.1-
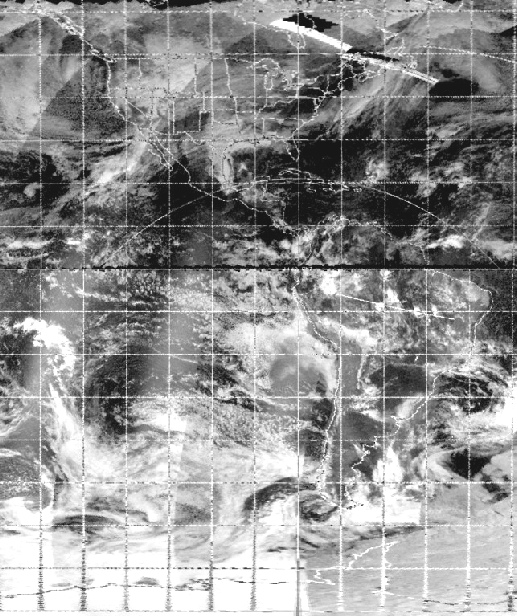
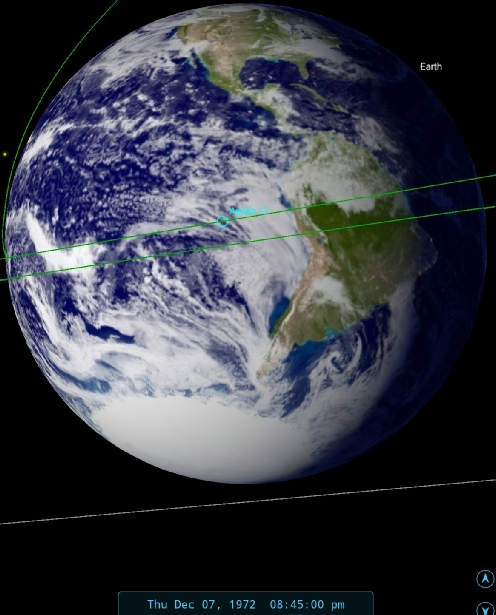
Figure 4.9.1-
As always, the description of what he is seeing is absolutely spot on, both in terms of what land masses should be visible and the weather patterns on it.
Later on, Schmitt joins in the forecasting:
017:23:53 Schmitt: Gordy, I don't know what your weather is like down there, but from here it looks like you're probably overcast today. Might even have a pretty good storm going.
017:24:04 Fullerton: Well, it's gray and cold and a little rain, so your -
017:24:14 Schmitt: Yeah, it looks like Mexico, in general, is pretty nice, although there is a band of east-
17:25:24 Fullerton: Rog. You're a regular human weather satellite.
017:25:30 Schmitt: If Ron would just stop his maneuvers I'd tell you some more, but the Earth just set behind the LM.
017:25:38 Fullerton: Rog.
017:25:40 Schmitt: More specifically, it set behind the Rover, which may be a space first. [Long pause.] Pretty impressive storm system down off the west coast of Antarctica.
Again, we can compare what Schmitt should be seeing with what he’s describing (figure 4.9.1-
There is more of the Atlantic on view off the coast of Africa in this photograph compared with the first blue marble collection, but much more obviously the Cuddalore cyclone is now beginning to edge into darkness. Which places the photograph roughly an hour later than the original set. At around that time Schmitt continues with this planetary observations, often in response to comments from Capcom::
005:59:07 Schmitt: Yeah, I can see the part of South America that Wegener thought that fitted into the bend in Africa some many decades ago and started people thinking about moving continents around on the crust.
006:00:17 Schmitt: Bob, you certainly do have a very clear intuitive impression, although the evidence is hard to pull together, that the -
006:02:14 Schmitt: Well, that sounds like a pretty good guess, then. It looks like the intertropical convergence zone over Africa is starting to get more and more clouds in it now. I suspect as midday approaches, which is what we're seeing there, we can expect to see more and more moisture indications.
006:02:39 Overmyer: Rog. They're -
006:02:51 Schmitt: Yeah, some of those masses of what I suspect are cumulus buildups -
As usual, his weather observations match what can be seen in the photographs.
The next image is again part of the long sequence of photographs of a receding Earth. AS17-
Figure 4.9.1-
We can be pretty certain of the time thanks to Schmitt informing the ground:
007:56:44 Schmitt: [Garble] Bob, mag November November is 130 now. And I just took another set of Earth pictures.
With a frame count that ends in the photo used above in the magazine.
On the face of it the Apollo image is little different to the previous figure analysed, but there are some interesting points to be made. Firstly, the weather system discussed in much detail in preceding pages (identified by the purple arrow) has moved further eastward and is much more in line with the location given on the satellite image than the earlier Apollo photograph.
Secondly, the Earth is now less than a full disk – night is just beginning to fall across Arabia.
We already know that the ESSA time over Africa would be early morning on the 7th, and we therefore have another example of photographs that are consistent not only with the weather patterns described by the crew, but consistent with satellite images taken at the same time, and that also show a consistency with the mission flight path.
As an aside, we’ve now got a complete collection of photographs showing the area covered by the Landsat image (figure 4.9.1-

The time has been set largely thanks to this remark in the transcript:
005:08:38 Evans: Houston, magazine November November's on about 123 right now.
Which marks the end of the Blue Marble sequence. Evans’ words suggests he was in charge of the camera, but Schmitt is n record as saying he took it, eg in this video.
“The Blue Marble photograph I took as part of a long series of photographs that were documenting my weather observations of the earth. That was one of my major activities I had planned to do, it wasn't in the flight plan but I plan to do as an amateur meteorologist to look at the weather patterns of the Southern Hemisphere and how they not only what they were but how they developed over the course of three days".
No doubt Cernan also stakes a claim to it somewhere!
Returning briefly to the 16mm footage, it’s notable that there are two sequences of footage showing it, separated by a longer shot of the departing S-
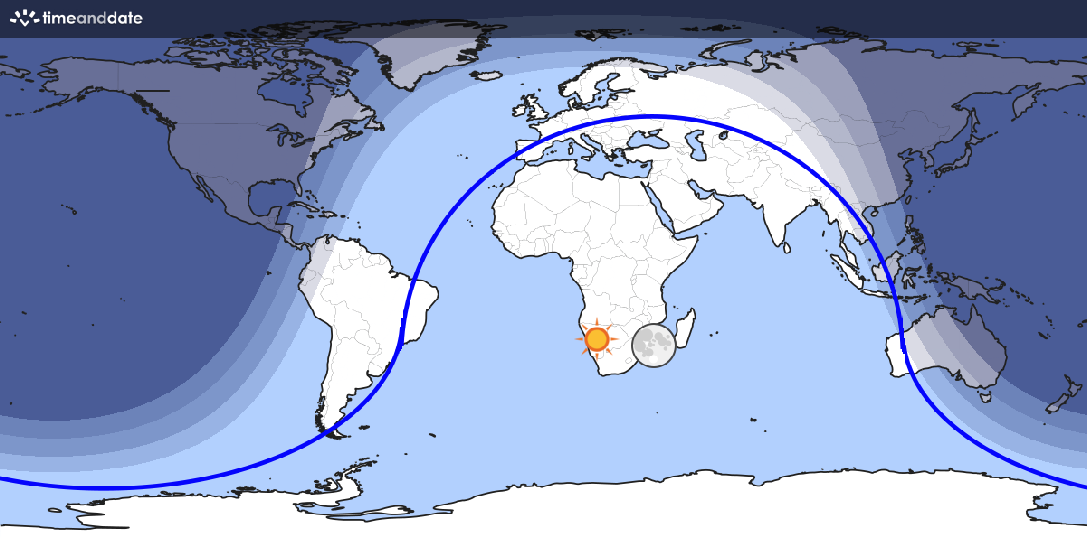
Figure 4.9.1-
Figure 4.9.1-
The animation does suggest movement, but it’s impossible to discount the effect of re-
While we’re here, it’s worth addressing a common flat earth claim about this photo, that somehow the blue marble doesn’t show what it should. These morons usually claim that too much is hidden, or that not enough daylight is being shown. They seem to forget that because Earth is a sphere, you can’t see bits beyond the horizon, and that just because something isn’t visible it doesn’t mean that it’s dark. Here’s a map of what the daylight area should be at the time of the photo (figure 4.9.1-
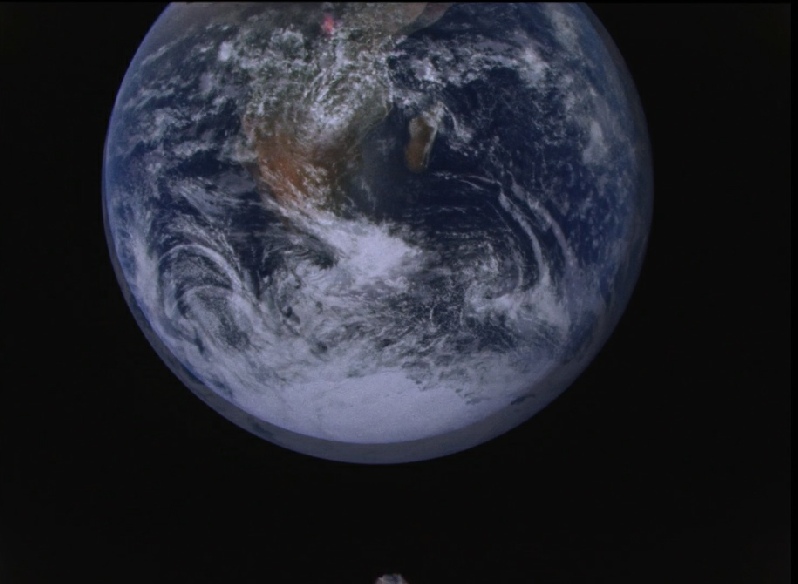
Figure 4.9.1-
Pretty unequivocal -
Figure 4.9.1-
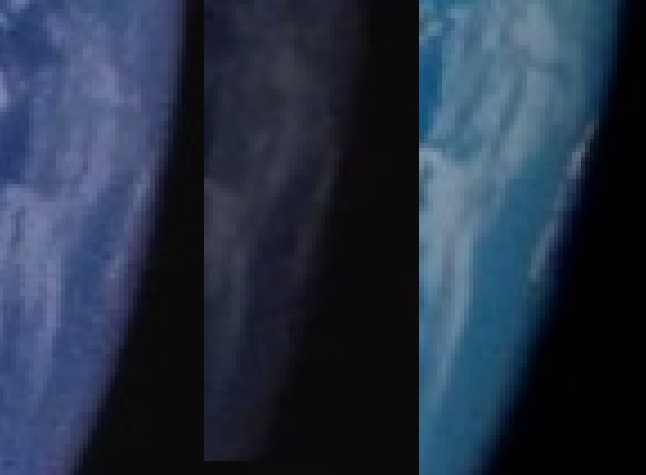
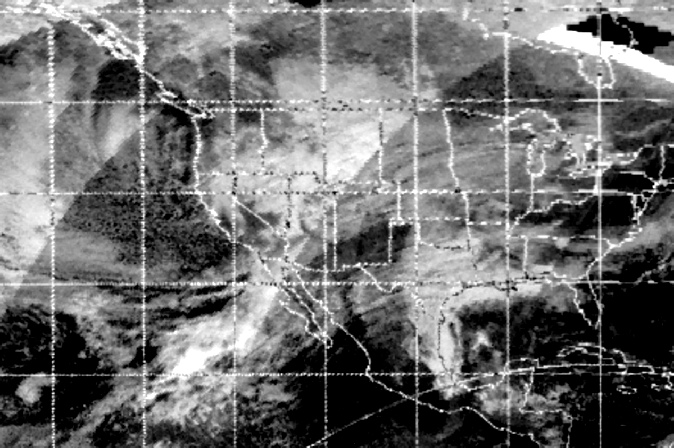
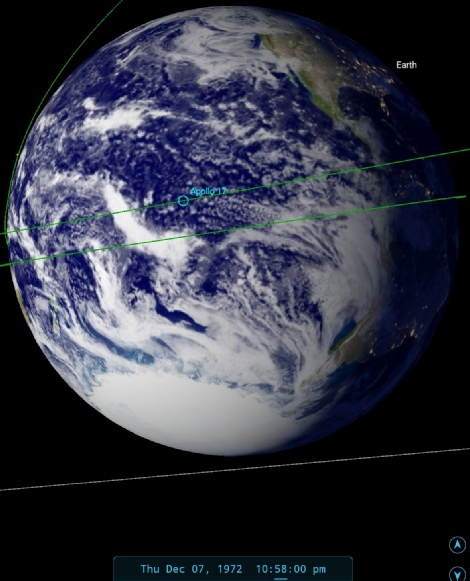
Figure 4.9.1-
Again, we can see that the descriptions match exactly what would be expected. We can confirm that it was Schmitt’s intention to supply these descriptions for direct comparison with satellite images by reading this Australian article (figure 4.9.1-
That’s it for the mammoth first day -
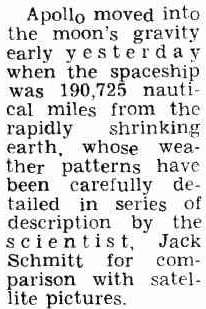
Figure 4.9.1-