4.9.M Synoptic data
Disappointingly, given the many and beautiful pictures taken of the weather during their voyage, there are relatively few opportunities to compare with the synoptic charts of the day.
This is thanks to a combination of most of the images being from the southern hemisphere, and also a large gap in the German data that has proved so useful so far.
The daily weather charts are available for north America, but for the most part there are few opportunities to use them. Mexico charts are available for the mission periods, but they add little to the information given by the north American ones (as will be seen shortly). There are many pictures of Africa, and so the South African data are useful, but it is a shame that more of the continent is covered. There may be other data sources out there, but they have not been uncovered during the writing of this report. A final problem is the fact that most of the images are taken during the outward journey, and cover only a few days. The period on the moon and the return have many fewer images and those that do exist are, obviously, of a much narrower Earth crescent.
The first image compares the African part of the 'blue marble' image with the South African weather chart from 7/12/72. This can be seen in figure 4.9.M.1.
The two fronts marked on the synoptic chart are so obvious there is no need for arrows, and it is interesting to note the high pressure zones south of Madagascar and west of South Africa are largely cloudless, in short, the Apollo image shows exactly what it should.
On the 8th of December, two images were taken that cover Africa and the Americas, and therefore we can introduce the chart from North America as well as Africa. Figure 4.9.M.2 below shows a section of AS17-148-22743 compared with the South African synopsis from 8/12/72.
The progression of the weather fronts across South Africa over 24 hours is self-evident in both the Apollo image and the synoptic chart, and the two fronts marked on the synopsis are again obvious. The high pressure zone between the two fronts is not clear of cloud, but the cloud is broken. Highs to the north of both fronts are much clearer.
The situation in north America is shown in figure 4.9.M.3.
The red lines on the Mexican chart are used to emphasise thin lines that appear to be those of fronts. It is unclear what the dashed lines are meant to imply on the drawings.
The main point to make about the north American image is the good degree of correspondence between the hand drawn Mexican chart and the more modern looking chart from the NOAA, despite the many obvious amendments of the former. While they are not identical, there are broad similarities.
The meandering front across the continent (blue to green) is well marked, and zooming in closer to the image makes it possible to differentiate between the leading and trailing edges of the large bank of cloud that marks the border between that front and the one to the south (red arrow). The line marked in yellow seems to match the orientation of the cloud seen in the Apollo photograph, even if it does not quite match the orientation of the NOAA front drawn several hours earlier.
A similar exercise can be undertaken for the following day. AS17-148-22749 and 22758 show most of |Africa and north America respectively. The South African comparison is shown in figure 4.9.M.4. North America's data are shown in figure 4.9.M.5.
Figure 4.9.M.4: AS17-148-22749 compared with South African synoptic chart from 9/12/72
Again from South Africa we see a development of the frontal systems from the south-west, and there is also the fact the cloud mass in the Apollo image is oriented east-west as is the frontal system, in the front, showing again that the two correspond well. The NOAA and Mexican data also see good correspondence with the Apollo image. The long sinuous front shown on the NOAA image is matched by that on the Mexican one (although the markings on the latter were difficult to see and have been emphasised in red here. Florida is just out of view on the Apollo image, and thus it was not possible to place the front there reliably.The 10th of December sees another good image of South Africa in AS17-148-22763, and this is shown below in figure 4.9.M.6.
The three fronts on the chart can easily be found on the Apollo image, right down to the right-angled bend in the system to the west.
There is also a blurred view of north America available on the 10th in AS17-149-22779 (figure 4.9.M.7).
The Mexican chart showed no front, but does show the same undulating front boundary area along the Mexican border. It has been omitted as much for space reasons as for the fact that it doesn't show as much detail as the NOAA chart. What is visible on the Apollo image is that long front across Mexico and the Gulf, showing a band of cloud along the cold front to the north of it.
Africa has one final bow to make in AS17-152-23278, which was taken on the 16th. Figure 4.9.M.8 shows South Africa with its attendant frontal system visible in both the Apollo image and the synoptic chart.
The curl of the band of cloud off South Africa is, as with the other images, self-evident on both the synoptic chart and the Apollo image.
Although, from the 16th, German data become available, the angle of the Earth and the size of the crescent visible means that little is added to the debate by including them, and as a result this section of this research will come to a close.
Nine missions sent around the Moon and back, all shown to have weather patterns in the photographs they took that conform with the synoptic data taken in several countries, and with satellite images from a number of different satellites in images that were available to anyone who cared to look at them.
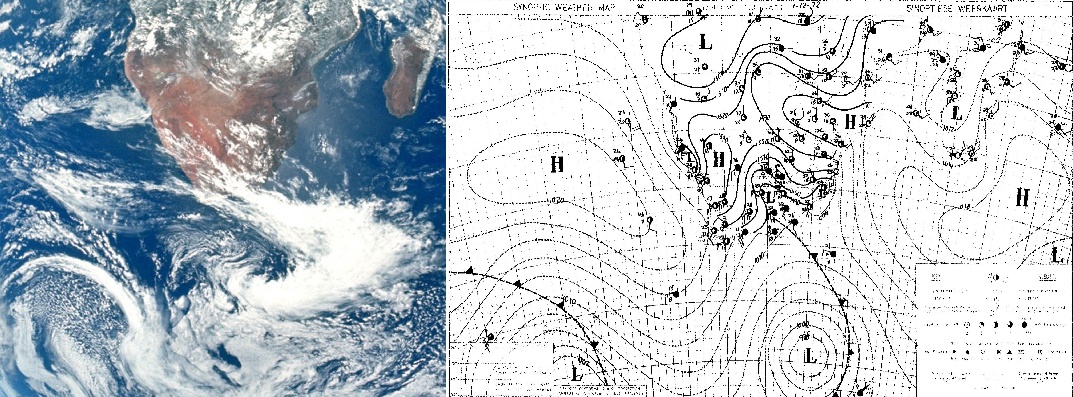
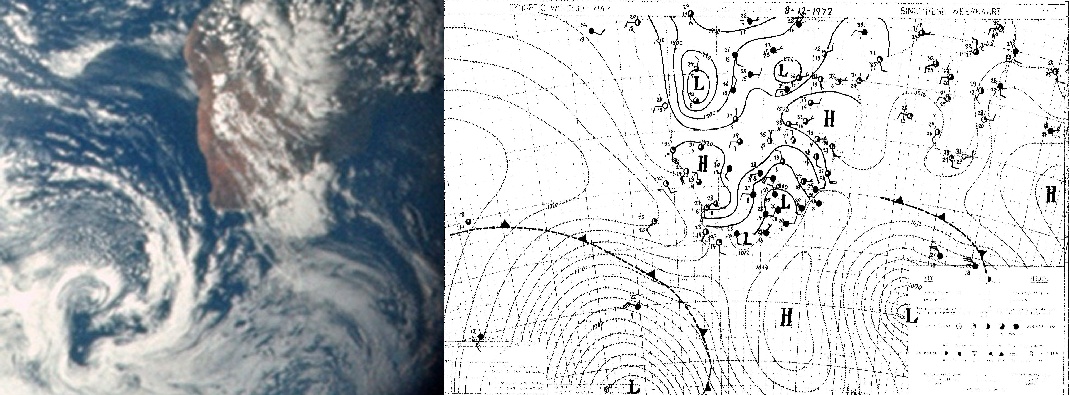

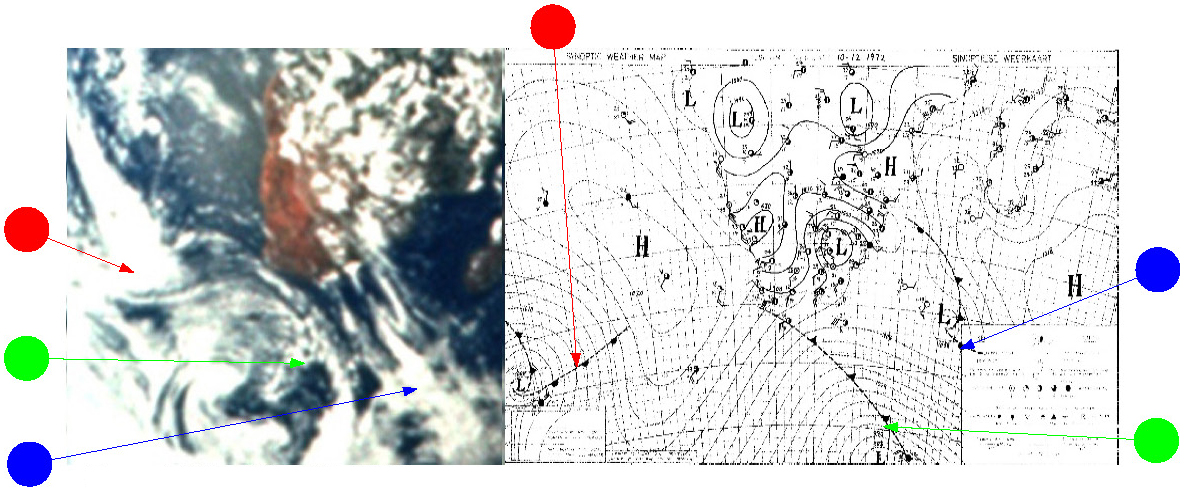
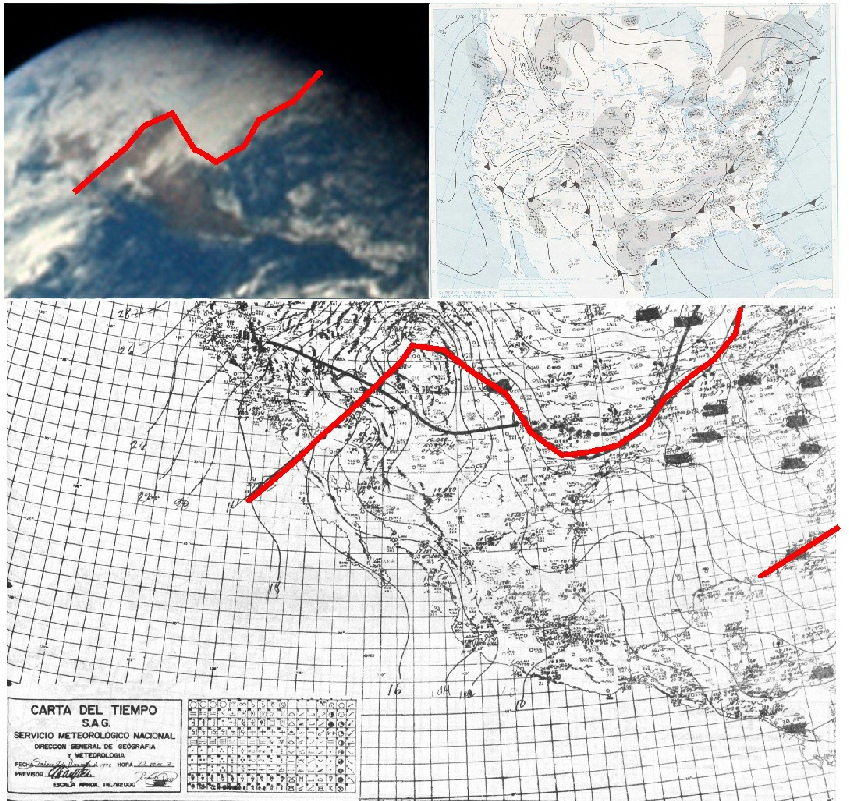

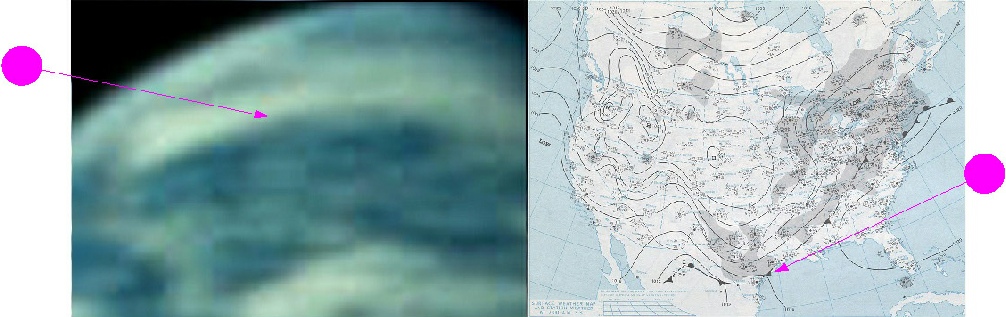
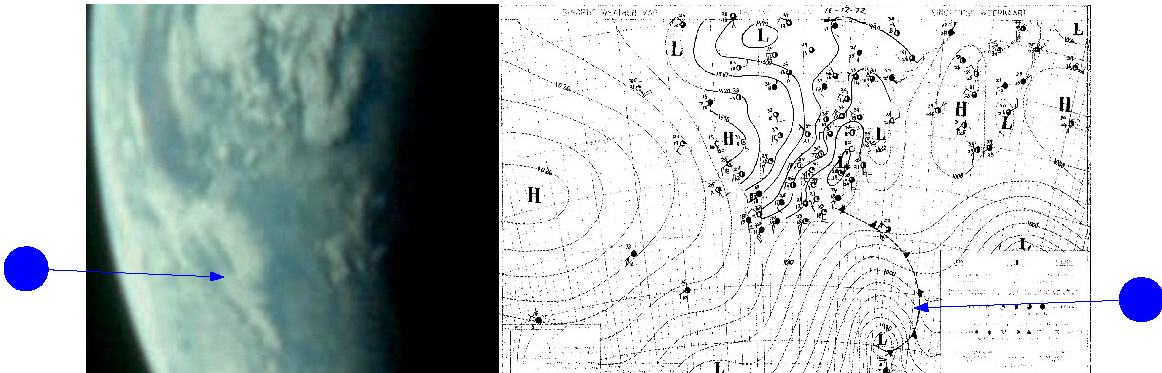
Figure 4.9.M.1: AS17-148-22725 compared with South African synoptic chart from 7/12/72
Figure 4.9.M.2: AS17-148-22743 compared with South African synoptic chart from 8/12/72
Figure 4.9.M.3: AS17-148-22745 compared with NOAA (top right) and Mexican (bottom) synoptic charts from 08/12/72.
Figure 4.9.M.5: AS17-148-22758 compared with NOAA (top right) and Mexico (bottom) synoptic charts for 09/12/72.
Figure 4.9.M.6: AS17-148-22763 compared with South African synopsis from 10/12/72.
Figure 4.9.M.7: AS17-149-22779 compared with NOAA synoptic chart from 10/12/72.
Figure 4.9.M.8: AS17-152-23278 compared with South African synoptic chart from 16/12/72