4.3.M -
Thanks to the fame of the mission, many of the Apollo missions' critics and doubters focus on it in their endless search for the trivial that they believe will help to defend their position. The corollary to this is that much research has been done for Apollo 11 to support it.
Apollo 11's synoptic charts have already been examined in some detail on sites like Apollohoax.net, and at the end of this article on the Apollo TV broadcasts. These have tended mostly to focus on the data held as NOAA's weather charts for the USA. This report has deliberately not referred to this other work when writing the following discussion in order not to be influenced by them. The reader is free to make their own interpretations of the data available and use their own methods.
As well as the NOAA data, the same German and South African sources available for Apollo 10 are available here, and these are all from the same source as the Apollo 8 analysis. The Apollo 11 source for German data is here: http://docs.lib.noaa.gov/rescue/cd282_pdf/LSN1163.PDF and the South African data here: http://docs.lib.noaa.gov/rescue/cd126_pdf/LSN0734.PDF. There are also synoptic charts from Pakistan. Other sources are available that contain meteorological data, but these tend to be numerical records rather than charts and aren't useful.
A few days from the mission will be chosen that allow the maximum use of the available charts, starting with an image that was dealt with earlier and two images taken before and after it. AS11-
Figure 4.3.M.1 shows these Apollo images in comparison with German and NOAA charts.
As with previous sections for Apollo 8 & 10, no claim to in-
NOAA, for example, place a cold front off western Canada/USA (blue arrow) that isn't identified on the German synoptic chart. NOAA also place a pattern of broken fronts across the mid-
What should be evident is that German & South African meteorologists drew weather charts that match the systems on an Apollo photograph. Sceptics can argue about the independence or otherwise of NOAA staff (it would be interesting to see them say it to their faces), but any arguments suggesting that weather scientists with absolutely no connection to NASA or the Apollo mission were also in collusion begin to stretch the already tortuous conspiracy argument even further into the realm of the ludicrous.
After the 18th there are relatively few Apollo images that provide useful vantage points from which we can compare synoptic charts, as the timing of the mission and the angle of the Earth as viewed from the Moon means that the usual northern hemisphere land masses are generally unavailable, at least for the period in lunar orbit, and other than South Africa, southern hemisphere data are not available.
For the period covering lunar orbit, we are therefore reliant on just two images, AS11-
Not enough of southern Africa is available for a worthwhile comparison with the synoptic chart, as the only front (and therefore the only part of the only part likely to show any significant cloud formations) marked on the chart is in an area in darkness on the Apollo image, and for this reason only the NOAA and German synoptic data will be used.
Figure 4.3.M.2 shows these two Apollo images compared with the synoptic charts. As indicated, there are relatively few identifiable fronts on the weather charts, but the persistent front across the northern USA stretching into the Atlantic is still identifiable, as are the fronts associated with the depression off northern Europe. The high pressure zone marked over northern Canada is also producing a relative lack of cloud over that region.
While most Apollo 11 images from the vicinity of the moon are of Australia, AS11-
There is really only one definitely identifiable front on this image, the long one starting out over America (blue arrow) before heading out over the Atlantic (green arrow). The yellow arrow is used to suggest that the cloud mass visible on the Apollo image on the eastern horizon is the same as the front on the German chart, but this can not be absolutely certain thanks to the angle involved.
The final synoptic charts analysed are shown in figure 4.3.M.4-
Figure 4.3.M.4: German (top) and NOAA (bottom right) synoptic charts compared with AS11-
Figure 4.3.M.4 shows AS11-
The blue and green arrows identify a single weather front (as identified by our German friends) but showing broken cloud along it. This broken cloud is reflection of the nature of the air masses along that front, as hidden under the red line used to mark it more clearly here is a mixture of warm & cold fronts (in other words a change in the nature of the 'leading edge' of the air masses. The German meteorologists have perhaps oversimplified the situation in using one long line.
Figure 4.3.M.5 features AS11-
One final image is worth including. Newspapers have long included weather forecasts in their pages, and after contacting Honeysuckle Creek on their website about ARIA support for the Apollo missions, a scan of the synoptic chart from “Sydney Herald” newspaper was very kindly supplied. The image shows fronts marked off south east Australia, fronts which brought snow to the Australian Alps, and heavy rain and wind elsewhere. The map is dated 20/07/69, and is shown in figure 4.3.M.6 in comparison with views of Australia from that the 20th and 21st of July.
Figure 4.3.M.6: Sydney Herald chart dated 15:00 20/07/69 (local time) compared with AS11-
The frontal systems marked on the map show clear correspondence with those on the Apollo image. The time given on the newspaper is local, and thus the GMT would be roughly 03:00 on the 20th.As discussed previously, a professional meteorologist is better qualified to comment on these synoptic charts, but to any observant eye there is no inconsistency between the weather charts produced on the ground and the weather patterns visible in the sky, from space, on the way back from the Moon.
Apollo 11 then, finally brought to a close. The most historic flight ever made, documented and analysed from start to finish by the clouds shown TV broadcasts and still photographs, with every image consistent with the Earth's rotation and satellite photographs.
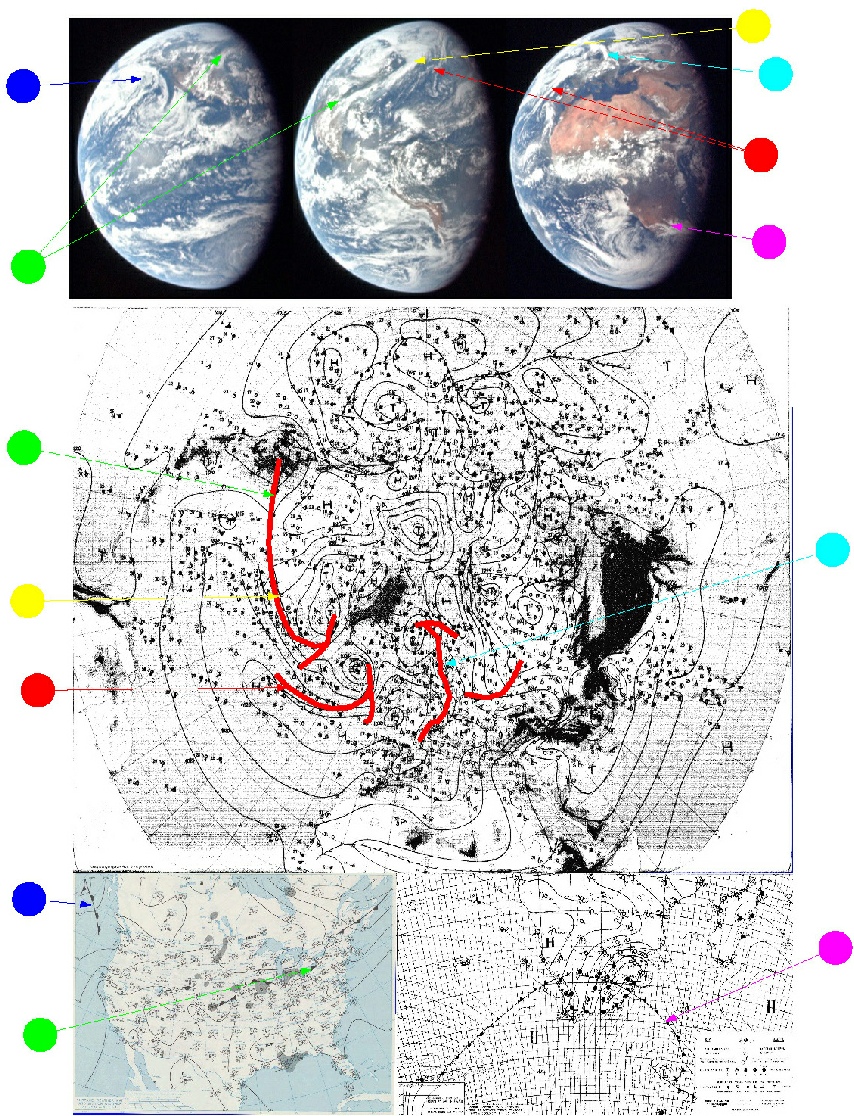
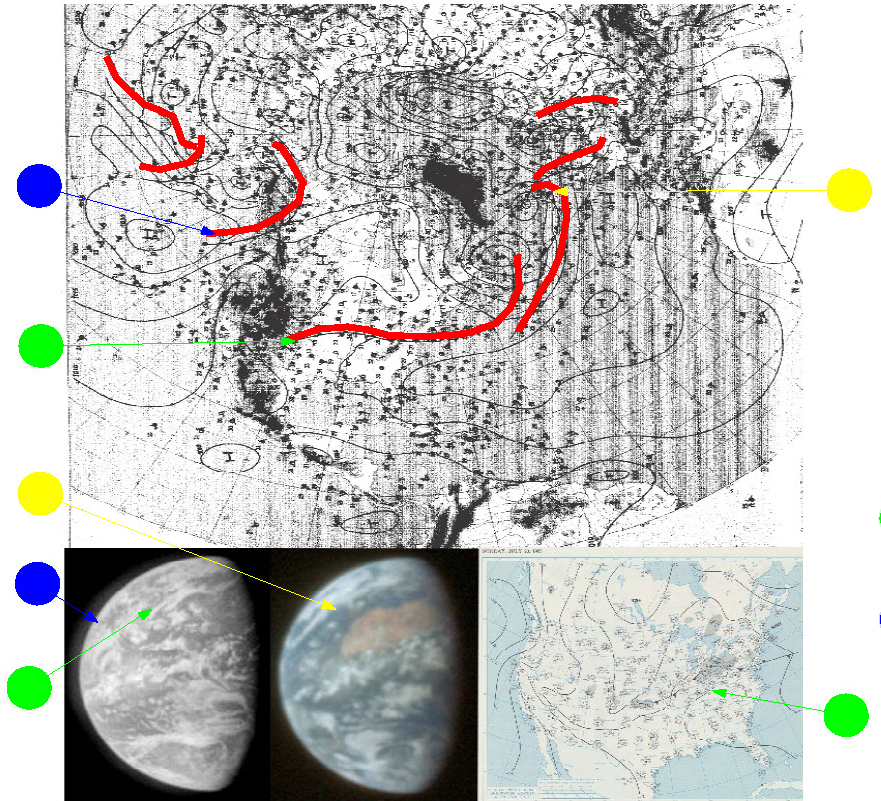
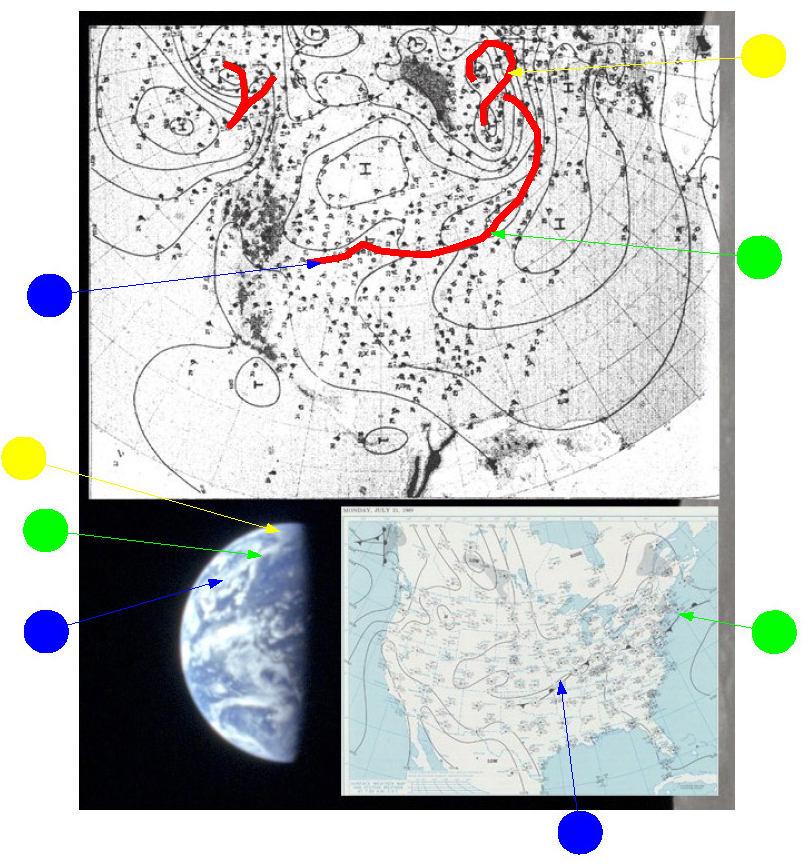
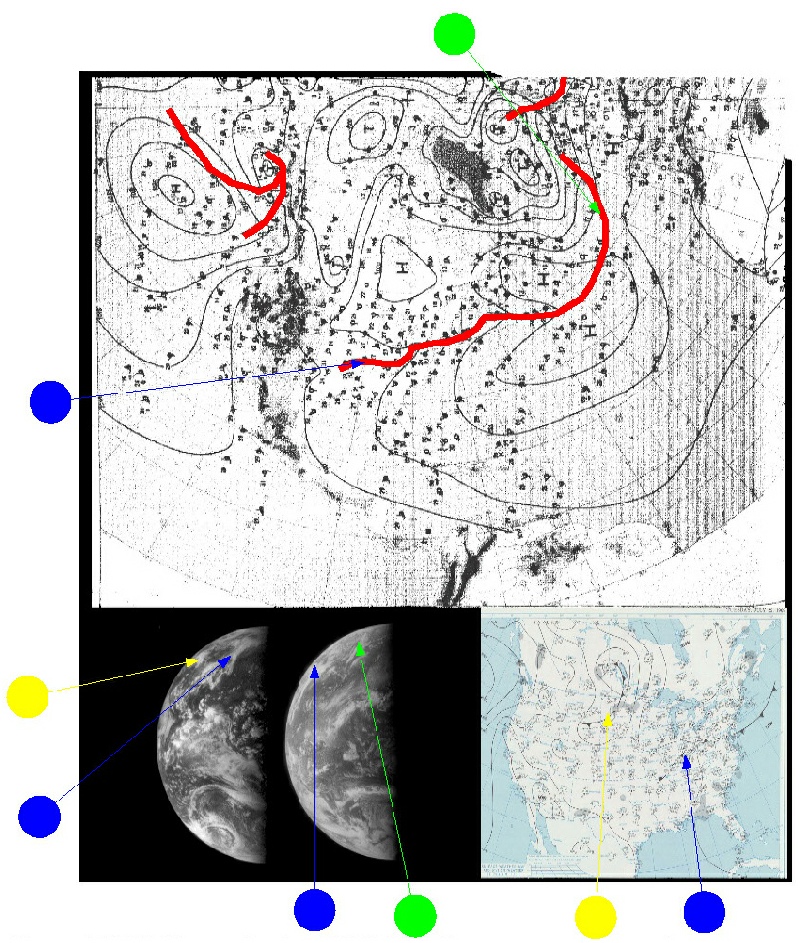
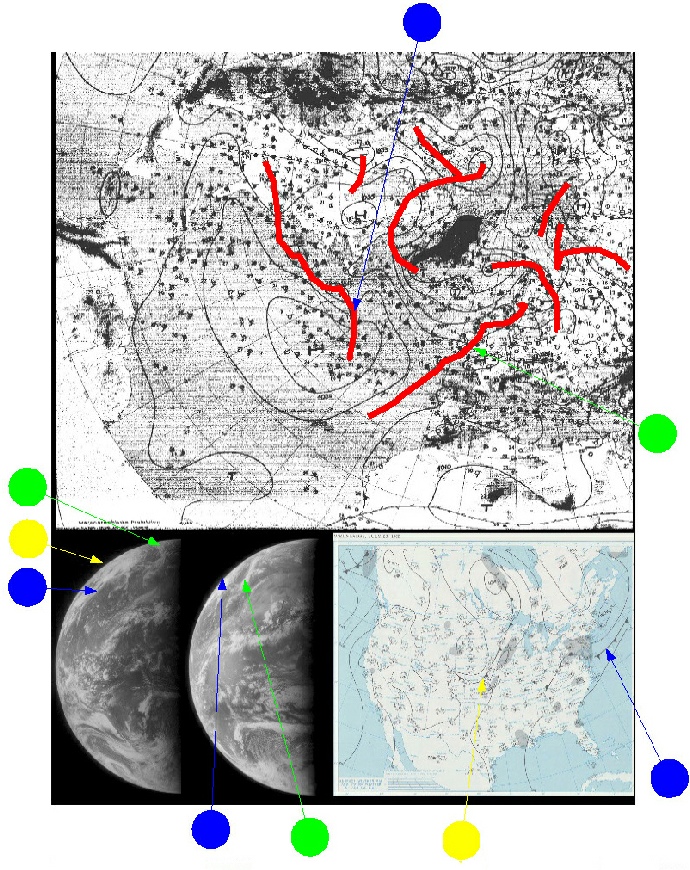
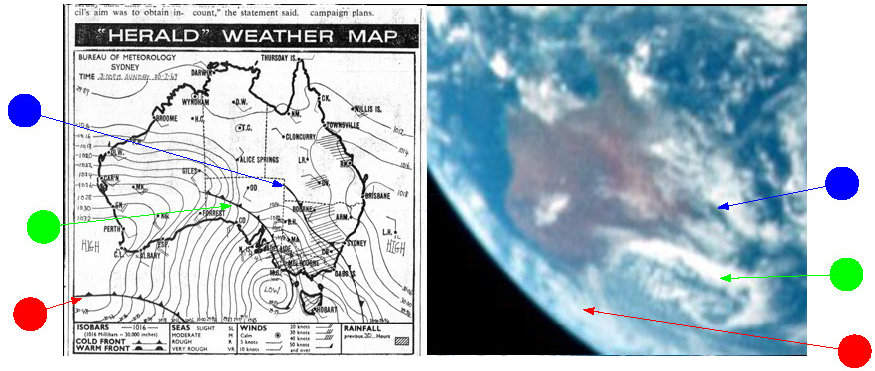
Figure 4.3.M.1: AS11-
Figure 4.3.M.2: German (top) and NOAA (bottom right) synoptic charts compared with AS11-
Figure 4.3.M.3: German (top) and NOAA (bottom right) synoptic charts compared with AS11-
Figure 4.3.M.5: German (top) and NOAA (bottom right) synoptic charts compared with AS11-