The document on the table is clearly a black & white satellite image (confirmed by colour videos), and available images shows that it covers North America and the North Atlantic from the 15th of July. Figure 4.3.0.2 shows the satellite image print-
4.3 Apollo 11 -
After the full dress rehearsal of Apollo 10 came the main event. Given the dramatic images sent by Apollo 10, it could be argued that this mission was less visually impressive. The crew spent most of the time on the lunar surface inside the LM, and did not venture far from it when they did finally emerge. Most of the photographs taken are of the lunar surface either from the ground or from orbit It is, nonetheless, the most historic of the Apollo missions, for obvious reasons.
The mission itself commenced with the launch on July 16th 1969. The crew entered lunar orbit on the 19th, after which the Aldrin & Armstrong entered the LM and departed for the lunar surface on the 20th, landing at 20:17 GMT. The crew set foot on the moon at 02:55 on the 21st, and left it for the safety of the LM at 05:11. The lift off back to the CSM was at 17:54, and the two craft were reunited at 21:35. TEI was at 02:55 on the 22nd, and the crew finally splashed down on the 24th.
During the mission they used 9 magazines to take 1408 images and made 7 TV broadcasts (not including the transmission from the moon itself). Several weather satellites are available from the time of the mission: NIMBUS, ESSA 8 & 9, ATS-
The NIMBUS data can be found here. This volume shows visible images from the Image Dissector sensor, and day & night infra-
In a recent find this website revealed the release of NIMBUS 3 Image Dissector Camera data on the National Snow and Ice Data Center website. The site allowed ftp access to both large size TIF images of better quality that those linked to above, as well as the individual ‘tiles’ that make up the image. Where possible, these will be given in the text in addition to the existing images. They have continued this work by looking at ESSA imagery, and kindly supplied some images relating to Apollo 11, which will be added for comparison. I have saved the documents here.
ESSA 9 data can be found here, hosted by the HATHI trust. I’ve compiled the relevant images into a single document here.
The ATS images have been found in from a variety of sources. A search for ATS-
An unnamed satellite contributes a further picture for July 21st in a document examining the first 5 years of the environmental satellite programmes in this TIROS report. An ESSA 8 image of tropical storm Claudia was uncovered in the Eastern Pacific 1969 Hurricane season report, as well as good quality images of Hurricane Bernice from July 16th. The Mariner's Weather Log Vol 13 provides a better quality ESSA 9 image of North America from July 22nd . This MSc thesis BOMEX study provides more examination of ESSA 9 images specifically in the Caribbean from almost all the Apollo mission, and larger scale images from the same study can be found here.
This 1973 report contains strips of ATS-
These documents are mentioned not just as potential sources for discussion but also for the indication they provide that the data from the satellites were not hidden away – they were available for use by anyone who cared to look at them. Another example is this publication, which contains a number of NIMBUS images taken during the mission. I’ll also be making use of the digitally recovered ESSA and NIMBUS data discussed in Chapter 2 and making 3D reconstructions where possible.
The Apollo images used will be the high quality versions found at the Apollo Image Atlas and the Apollo Lunar Surface Journal ALSJ. Newer resources are the Project Apollo Flickr Archive and March to the Moon sites, and these may also get used where appropriate. Some images are not displayed on the ALSJ, but their links can be deduced from those that are. Despite the obvious and understandable focus on the lunar surface, the crew did manage to capture a number of significant images of Earth both on the way to, on the surface of, and back from, the Moon.
For photographs of Earth taken from the lunar surface, I’ll be making use of figures generated by JPL Horizons using this batch file:
!$$SOF
COMMAND= '399'
MAKE_EPHEM = 'YES'
EPHEM_TYPE = 'OBS'
CENTER= 'coord@301'
COORD_TYPE= 'GEODETIC'
SITE_COORD= '23.47323, 0.67417, 0'
START_TIME= '1969-
STOP_TIME= '1969-
STEP_SIZE= '1 h'
QUANTITIES = '4,14'
REF_FRAME= 'IAU_MOON'
!$$EOF
Which generated this output for the entire duration of the crew’s stay:
Date__(UT)__HR:MN Azi____(a-
*******************************************************************
$$SOE
1969-
1969-
1969-
1969-
1969-
1969-
1969-
1969-
1969-
1969-
1969-
1969-
1969-
1969-
1969-
1969-
1969-
1969-
1969-
1969-
1969-
1969-
1969-
$$EOE
After the date, the columns represent the azimuth and elevation of Earth from the lunar module’s location, and the Observer sub-
Before proceeding to the analysis, there is an interesting aside concerning the satellite data covering the mission. That satellite data was available for the crews has already been discussed, and one example of that comes from images of the crew’s final breakfast before departure, during which flight director Deke Slayton gives them a final briefing. Video and still images exist of that breakfast, and the image in figure 4.3.0.1 shows that part of the briefing covered the weather at Houston.
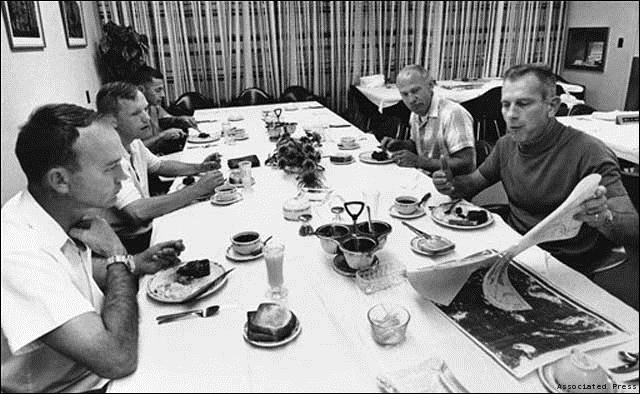
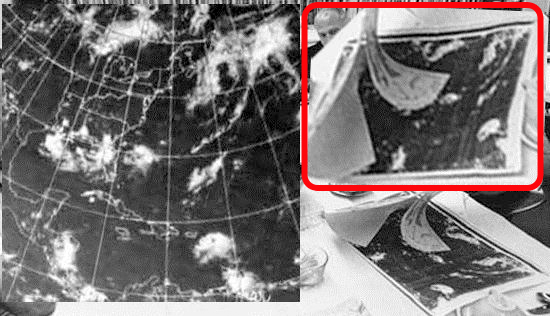
Figure 4.3.0.2: ESSA 9 image from 15/07/69 compared with satellite image used in astronaut briefing on 16/07/69
After breakfast, the Moon! Click the links below to explore the imagery and satellite data.
Figure 4.3.0.1: Deke Slayton shares breakfast with the Apollo 11 crew. Source