4.3.2 -
A few seconds into day 2 of the mission, as far as UTC timings are concerned, the crew began transmitting TV signals to Goldstone in California. These TV images were sent to Houston one hour later -
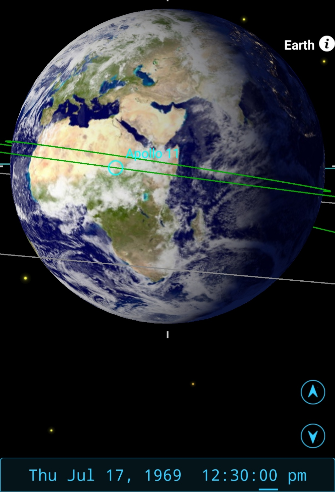
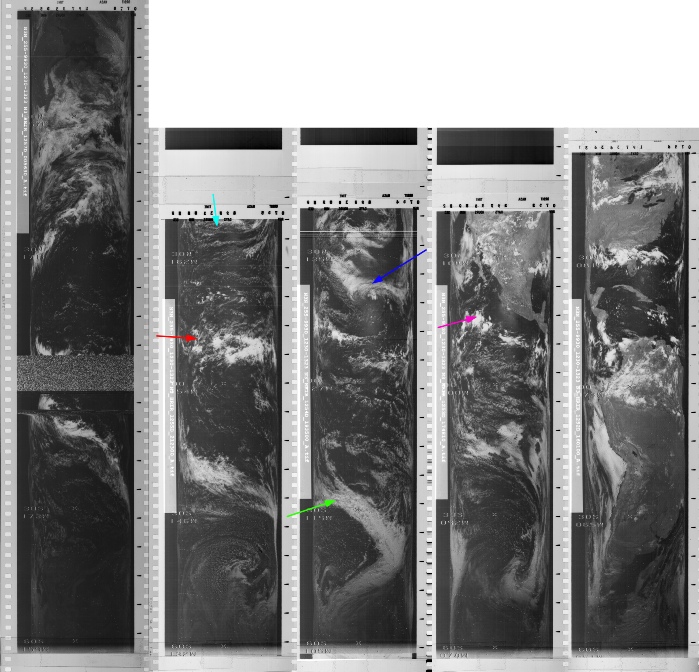
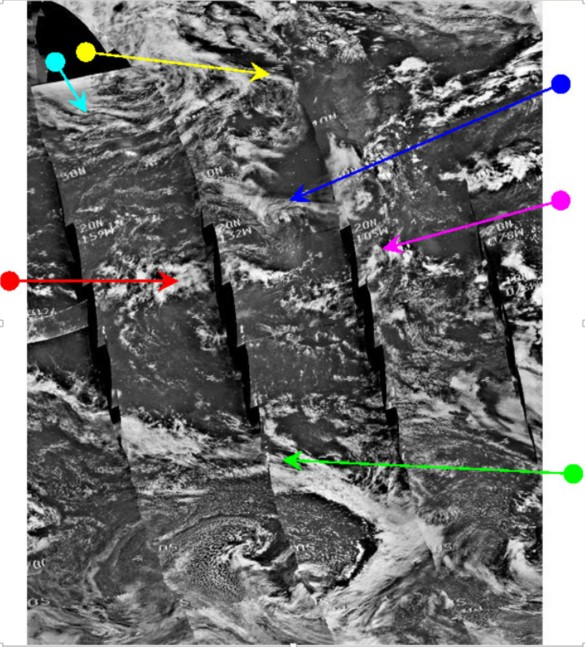
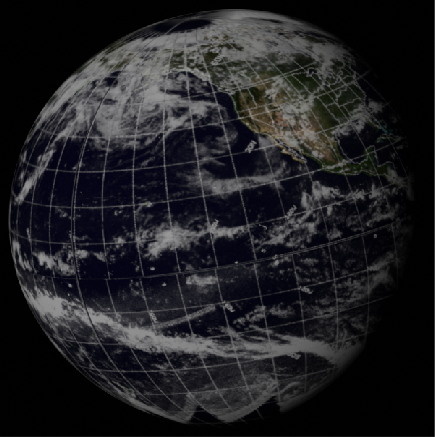
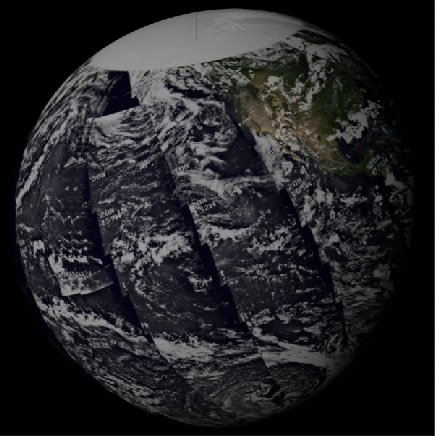
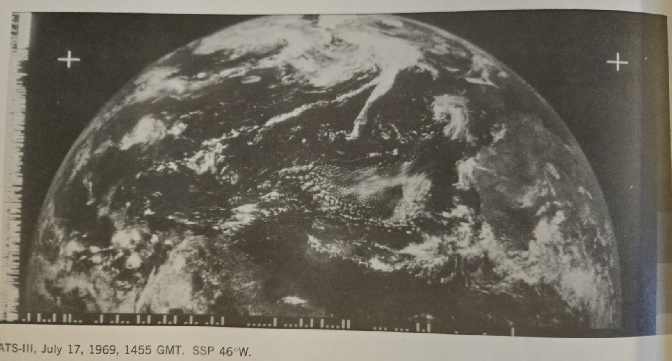
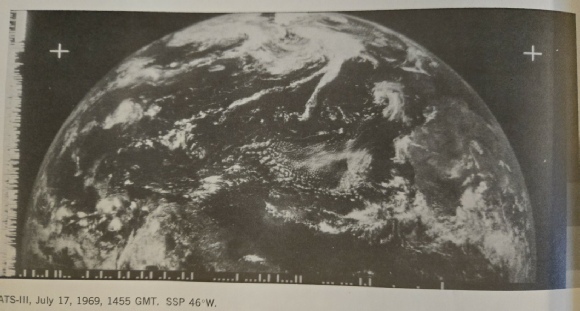
The broadcast footage is easily found on Youtube, particularly if you search for ‘Apollo 11 Facts Project although the best quality source for download is archive.org. Figure 4.3.2.1 is a screenshot of a camera test from the first broadcast, together with a SkySafari image showing the terminator line. The screenshot has had its resolution increased, the levels altered to provide more contrast and sharpened to improve the level of detail visible. The satellite images used in figure 4.3.1.7 have been reproduced here to save you clicking the back button.
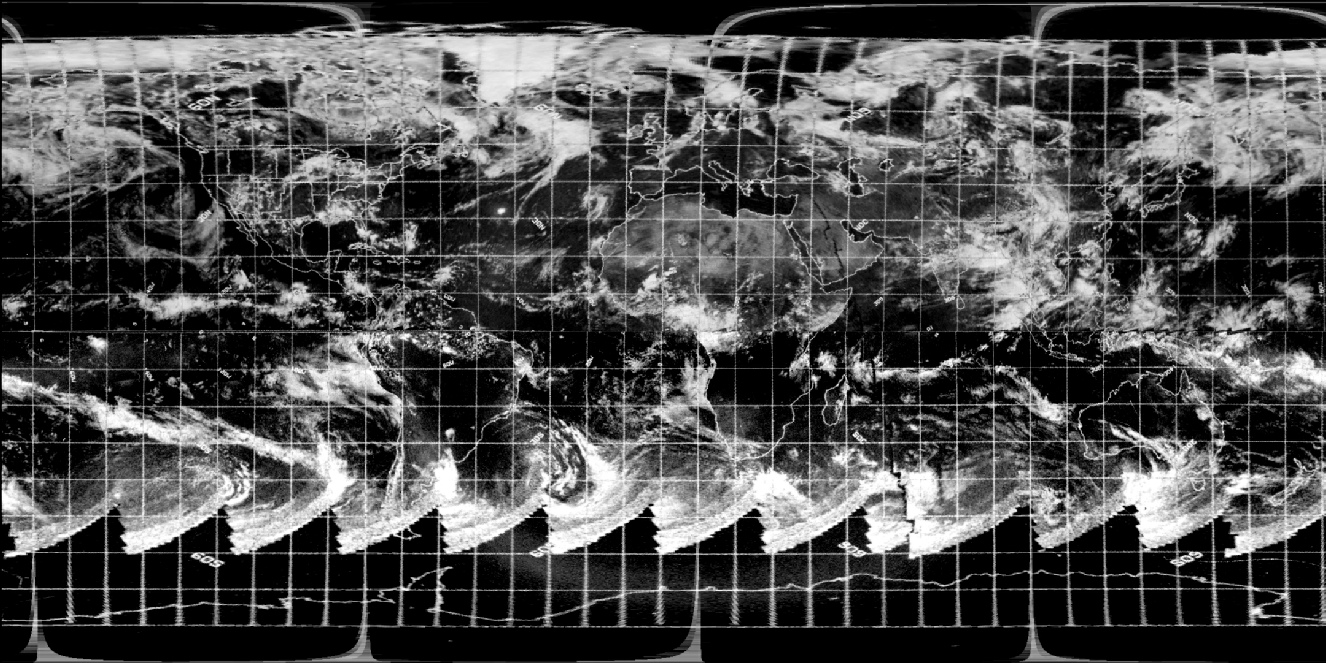
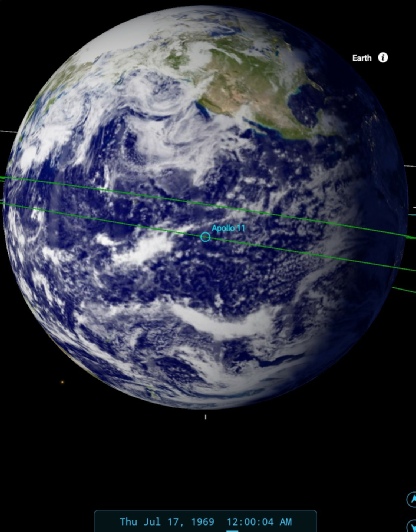
Figure 4.3.2.1: Apollo 11 TV broadcast crop with ESSA 9 & NIMBUS 3 IDCS (bottom left)and HRIR (bottom right) images. Below these are 3D reconstructions from digitally recovered data from ESSA (left) and NIMBUS satellites (right). Right is a SkySafari time estimate.
A few minutes into the broadcast, Armstrong describes the view:
010:41:10 Armstrong: Roger. We're seeing the center of the Earth as viewed from the spacecraft in the eastern Pacific Ocean. We have not been able to visually pick up the Hawaiian Island chain, but we can clearly see the western coast of North America, the United States, the San Joaquin Valley, the High Sierras, Baja California, and Mexico down as far as Acapulco, and the Yucatan Peninsula; and you can see on through Central America to the northern coast of South America, Venezuela, and Colombia. I'm not sure you'll be able to see all that on your screens down there.
Close examination of the video stills and also the Apollo photograph taken at the end of day 1 shows that this is exactly what they should have been seeing.
The comparison of the TV screenshot and that Apollo still image is useful for two reasons. Firstly, the rotation of the Earth is clear in the hour between taking the image and the broadcast, showing that they were not taken at the same time. In fact, it’s even possible to detect rotation of the Earth from the start and end of the sequence, even if you only use the 15 or so minutes that they are at maximum (figure 4.3.2.2).
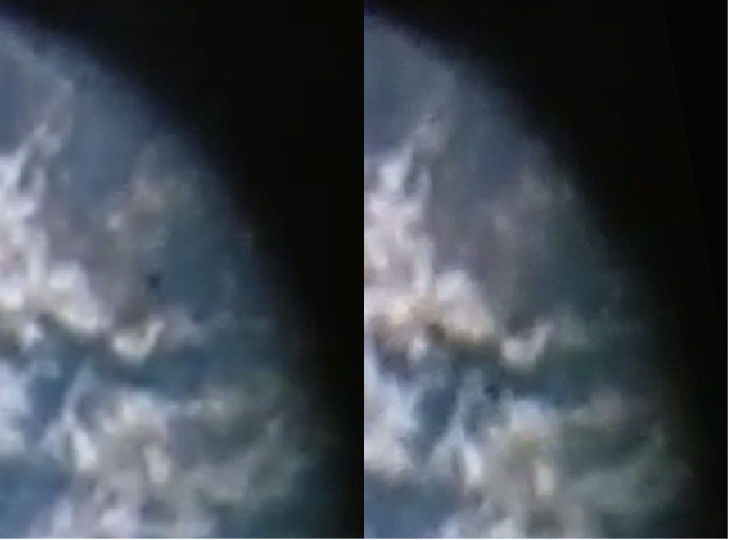
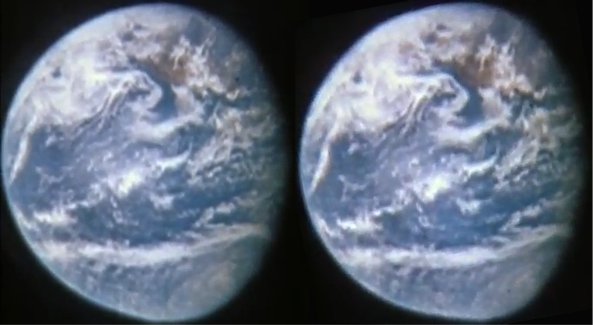
Figure 4.3.2.2: Screenshots taken at the start and end of maximum zoom from the unscheduled test transmission. The end screenshot (right) has been scaled and rotated to match the one from the start.
The best place to look is on the terminator, where it is clear that cloud masses have moved beyond during the broadcast.
The second, and by far the most important reason, relates to what is in these two images: Hurricane Bernice, the impressive depression referred to by Collins in EPO.
On July 8th 1969 a tropical depression began forming in the Pacific ocean. This depression strengthened to become a tropical storm, named Bernice, whose strength reached hurricane force on a number of occasions in its lifetime. By July 16th, Bernice was fading fast, and was reclassified again as a tropical depression off the coast of Guatemala. It still caused some problems for surfers though!
Bernice's lifespan and development was widely reported in meteorological journals, and is referred to in the Eastern Pacific Hurricane season report, and in the Mariner's log cited earlier. References to Bernice are widely available elsewhere on the internet. This US navy document: Summary of Tropical Cyclones 1969 shows that 35 warnings were issued to shipping, and gives detailed information of the hurricane's track. Figure 4.3.2.3 shows the storm's development as recorded in the hurricane season report. The same details can be found in this 1973 article. Even the Russians photographed it, as reported in this article. This guide to forecasting shows the storm in its earlier phases, as does this ‘best of NIMBUS’ publication from 1971.
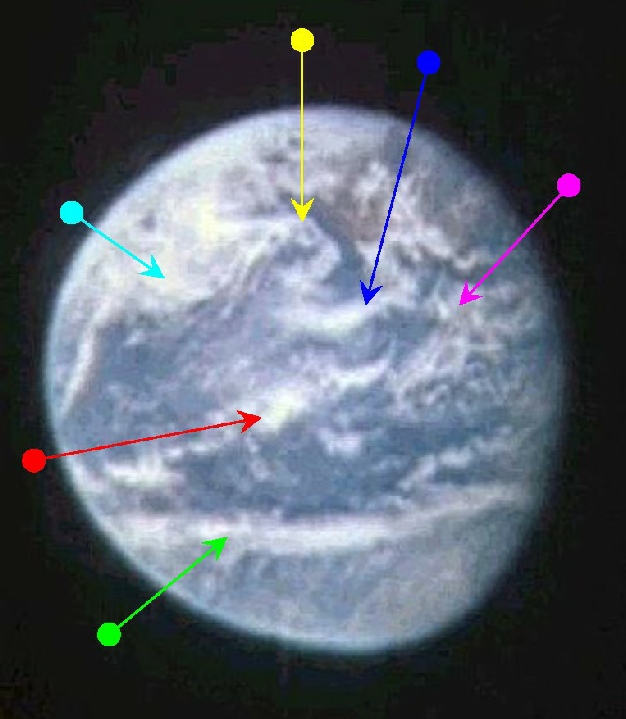
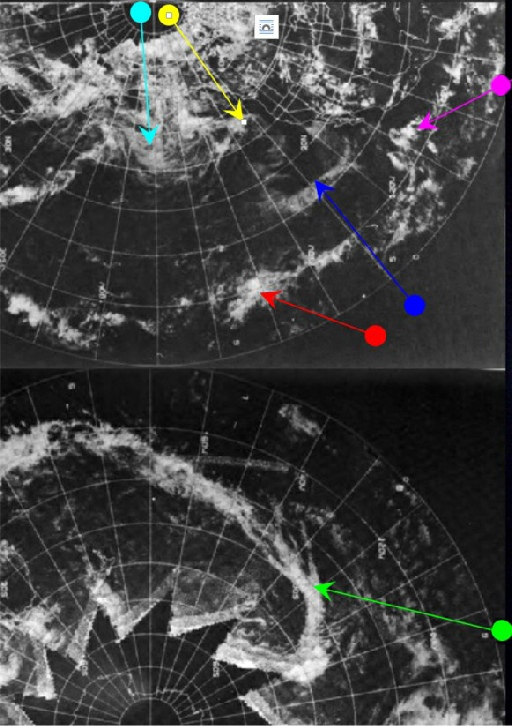
Figure 4.3.2.4 clearly identifies Bernice's location on the Apollo image & TV broadcast, indicated by the blue arrow in the preceding figures.
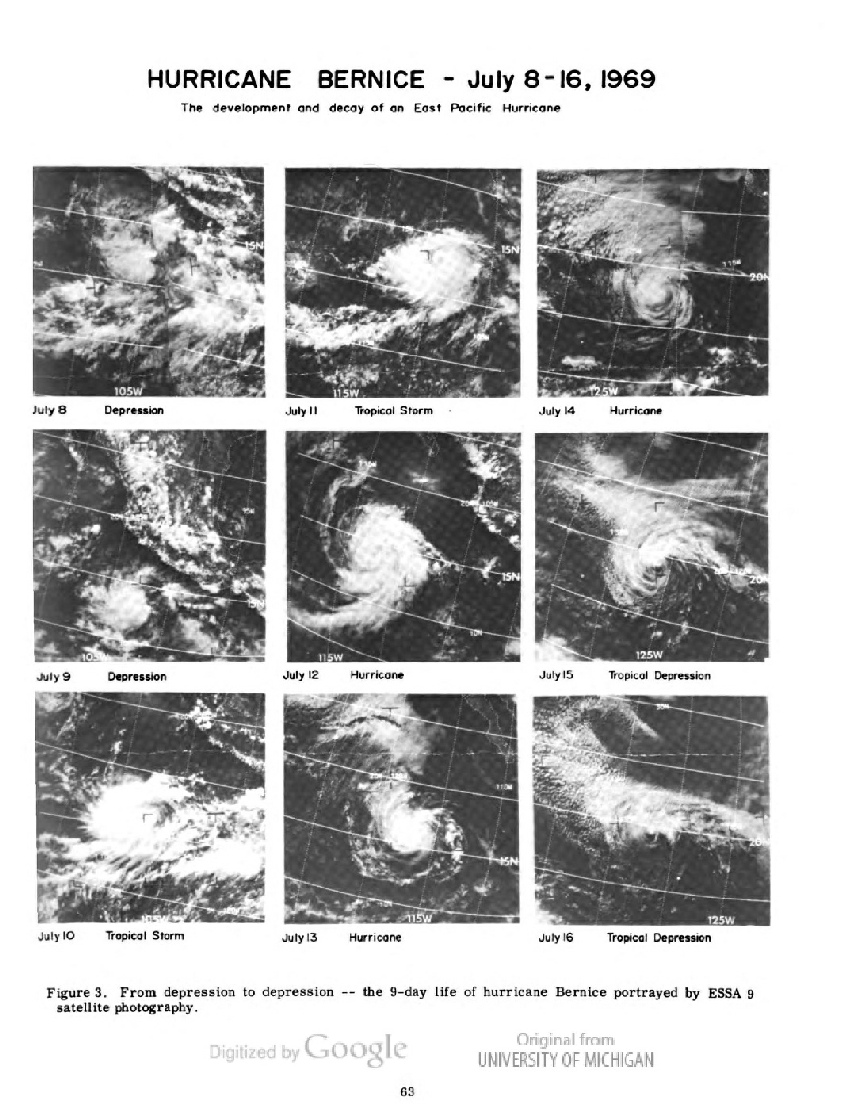
Figure 4.3.2.3: Left -

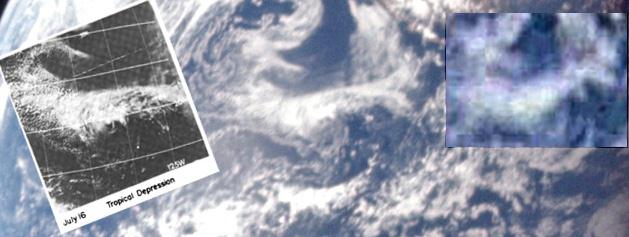
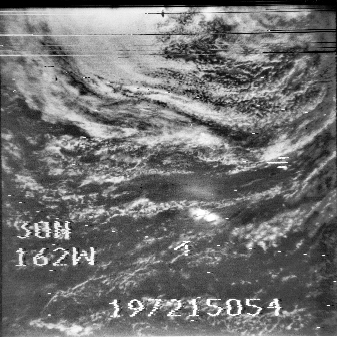
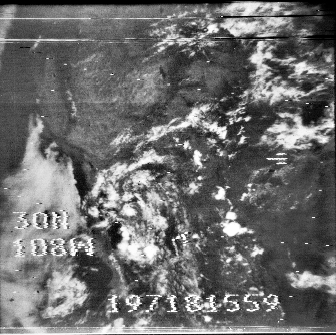
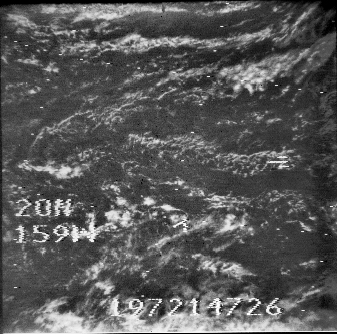
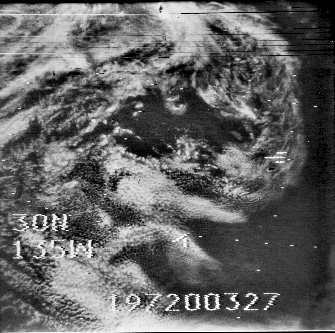
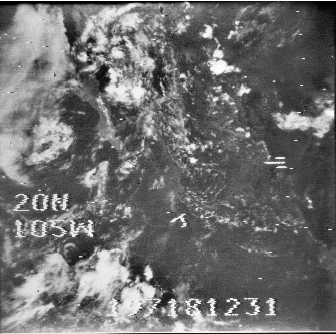
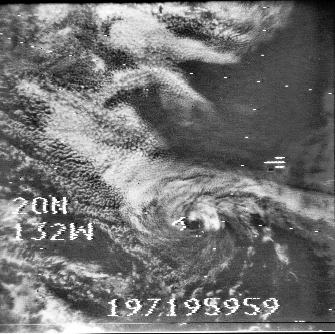
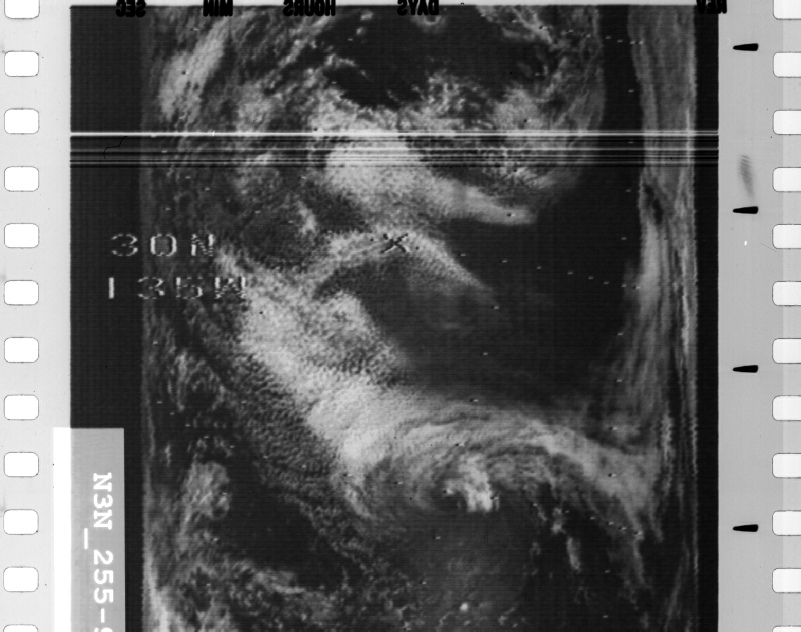
Figure 4.3.2.9: Close up of Hurricane Bernice from AS11-
Hurricane Bernice is clearly identifiable on both the Apollo derived images, and suggests that the only place the image & TV footage could have been obtained is from cislunar space. The filenames from the original sources reveal that the 6 restored NIMBUS images took a total of three and a half hours to photograph. The image centring on Bernice was done at 19:59 GMT.
As far as Hurricane Bernice is concerned, the irony here is that one of the most often quoted pieces of ‘evidence’ aimed at Apollo 11 (Bart Sibrel's 'A funny thing happened on the way to the moon' -
The first claim is obviously ridiculous, as low Earth orbit images can not show the entire disk -
The second claim shoots itself squarely and firmly in the foot by using video clips from the broadcast with Hurricane Bernice visible in them. Not just any footage of Hurricane Bernice, but specifically footage featuring Hurricane Bernice in a configuration that can only have been obtained on July 16th from space. It could not have been obtained anywhere else. Sibrel's own video contains the evidence that proves him completely wrong. He’s even taken to claiming that the Earth is actually a 1 foot wide model. Again, not physically possible to build that and skin it with a meteorology no-
He also claims he was sent the footage ‘by mistake’. This is also garbage. He was sent it because he asked for it. The “Not for public distribution” message at the start is no different to the ones you see on any film DVD (remember those?).
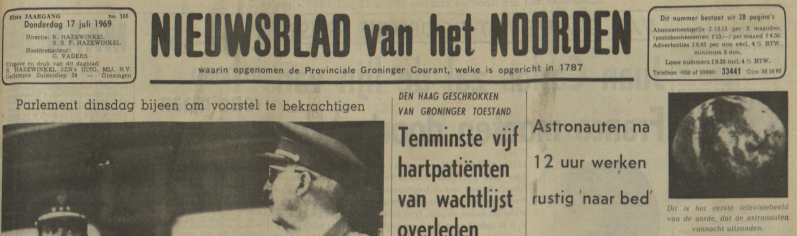
As with Apollos 8 and 10, we have supporting evidence from the media of the day to prove that the image of Earth shown on the screen is contemporaneous and not in the least bit secret as Sibrel claims. Figure 4.3.2.10 below shows the front page of a range of newspaper front pages, all of which feature the image, and some of which also feature commentary from the TV broadcast.
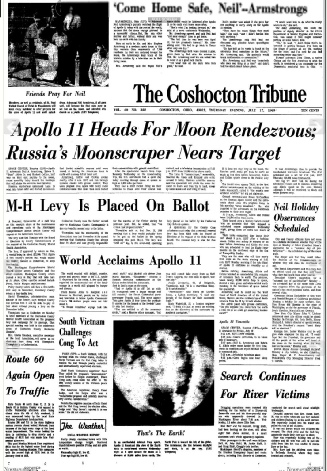
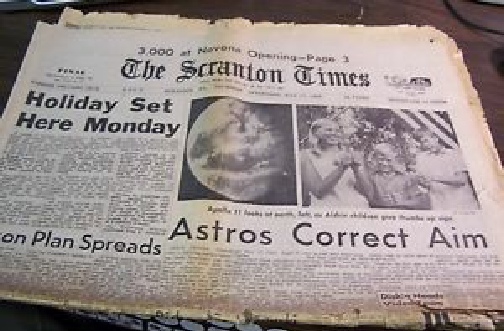
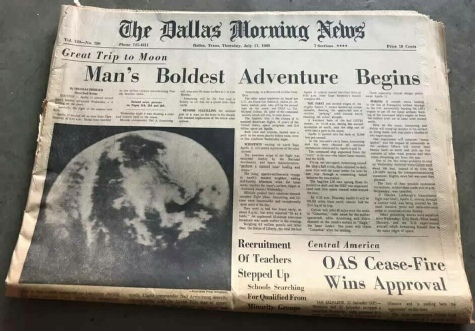
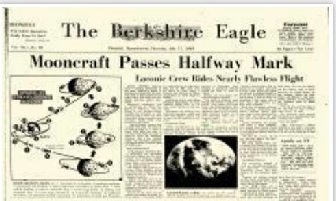
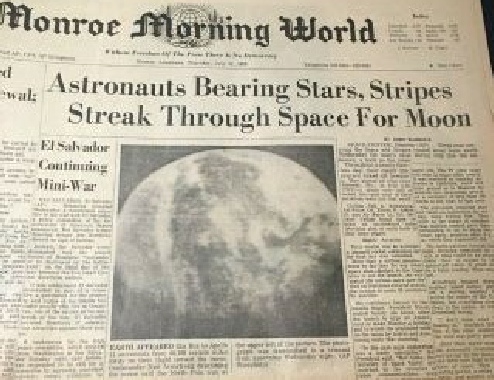
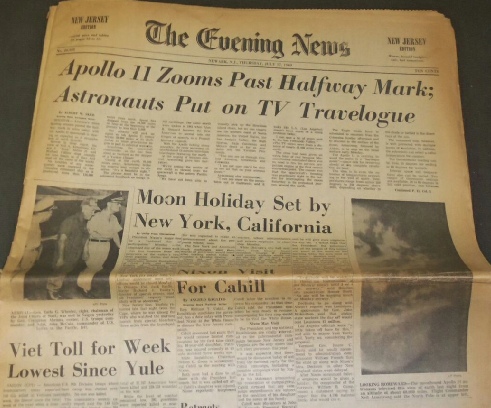
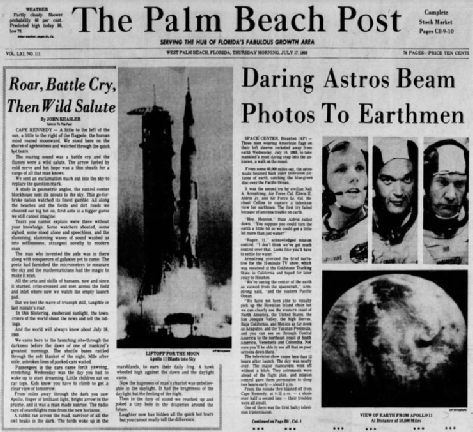
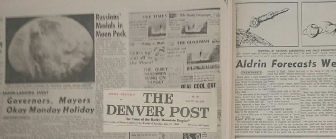
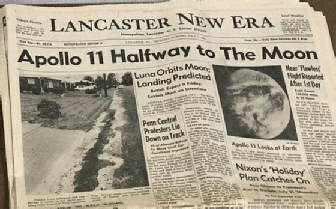
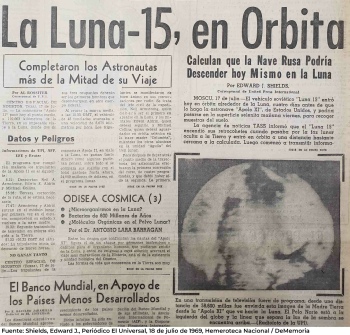
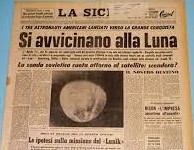
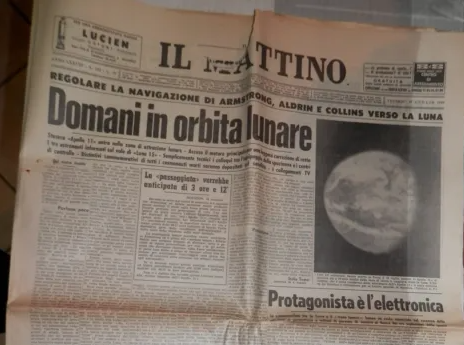
Figure 4.3.2.10: Variety of newspaper front pages, various online sources, dated July 17th. The Mexican “El Universal” article Bottom left) is dated the 18th and is linked to a story about the Soviet Luna 15 probe. The Italian papers are also dated the 18th. Left, ‘Rocky Mountain News’.
On the Coshocton Tribune page, available here, we are shown what is obviously a kinescope image of the Earth from the TV broadcast, and the newspaper is clearly dated the 17th of July. It also says this as the caption:
"In an unscheduled telecast from space, Apollo 11 broadcast this view of the Earth back to earth-
As Coshocton’s local time is 5 hours behind GMT, the transmission to Earth of this view was at 19:00 local time, with actual transmission on the evening news schedules sometime after this -
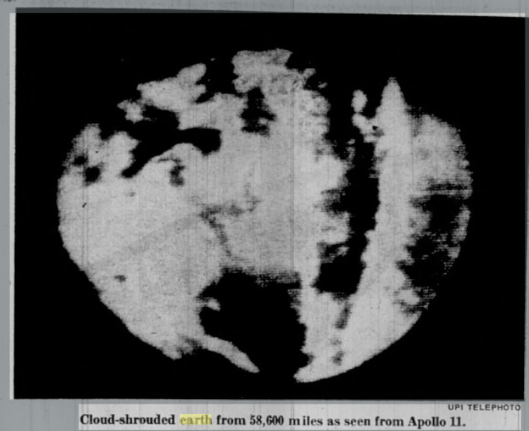
"Before retiring, Armstrong, Aldrin and Collins beamed an unscheduled 10 1/2 minutes of television back to Earth. The pictures, taken nearly 60000 miles deep in space, showed a blue, green and white swirled Earth receding in the blackness of space behind the spacecraft. Armstrong said he could see the West Coast of North America, all of the United States and the northern top of South America from his 13 by 13 window"
Likewise the Evening News from New Jersey says this:
"With the Apollo ticking along smoothly, the crew presented an unscheduled 15-
Before going on to quote the broadcast audio verbatim. The Palm Beach post confirms that the broadcast was recorded at Goldstone then relayed to Houston. The Daily News also has timings, saying that:
"While the astronauts rested, mission control treated the world to an unscheduled color TV show of the Earth as seen from some 60,000 miles in space. It had been taped by the Goldstone tracking station in California and was replayed at 9:45 pm New York time."
which is later than CBS’s news broadcast but still plenty of time to get into Thursday’s papers. All of the news papers reproduced here are dated the 17th, and all reference what was said in the broadcast, words that can be verified in the mission transcripts. It’s worth noting that the two Italian papers had less time available before going to press, hence their later date.
Figure 4.3.2.11 shows the TV screenshot analysed earlier in comparison with the image reproduced on the front page of the Tribune the following day. While our image is much clearer, there are still obviously identifiable features on the newspaper’s rendering of the scene. On the right is a photograph actually taken of the TV during the broadcast, part of a set of slides sold on eBay. Also included is my own copy of a wire photograph, dated July 16th, together with other examples available online.
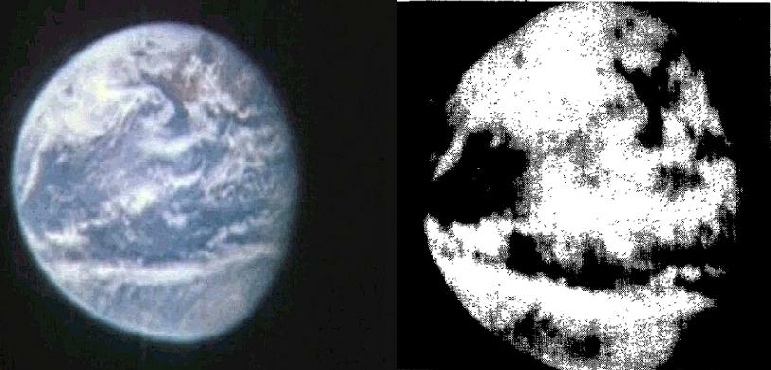
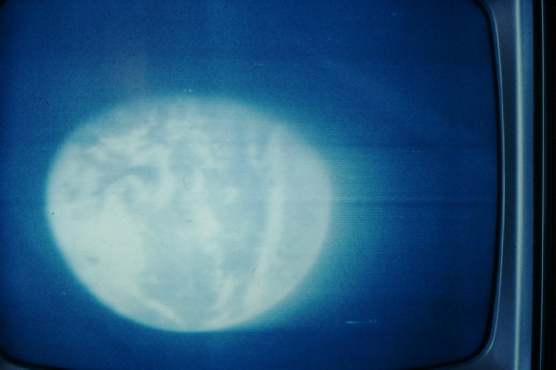
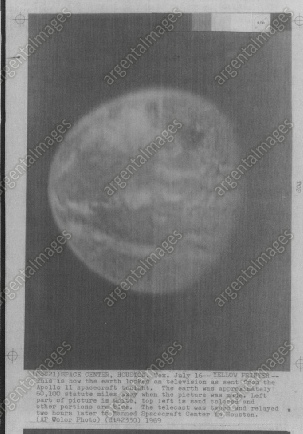
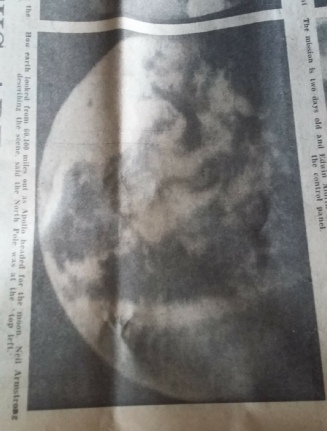
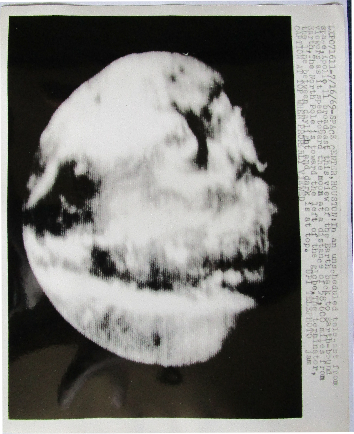
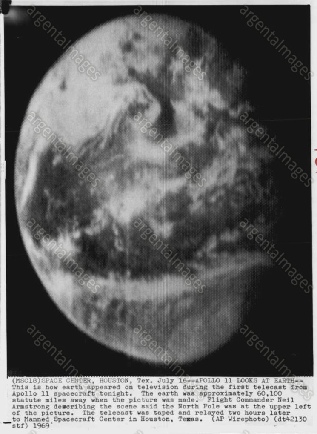
Figure 4.3.2.11: Top row: Comparison of TV broadcast screenshot (left), image from Coshocton Tribune front page (centre) and photograph of TV screen (right -
The ITCZ clouds running east – west, the north-
This website Apollo TV Analysis contains a much more thorough analysis of Sibrel's nonsense claims than will be covered here, and is the source of the screenshot images, as they are generally of better quality than those available elsewhere. What would be useful is to know exactly when the photographs examined above were first broadcast on TV, as this would allow us to definitely state that they could not have had a satellite image of the view with which to work. My suggestion is that it would have been highly unlikely, if not impossible. We can also confirm with certainty that contrary to Sibrel’s claims, the images were all public thanks to the book 10:56:20 Pm EDT 7/20/69: The Historic Conquest of the Moon As Reported to the American People by CBS News over the CBS Television Network, which was published in 1970 and a copy of which I own .
The book confirms that:
"On Apollo 11, the first "scheduled" transmission was in fact the third sent to Earth by Armstrong and his crew"
As part of a pictorial essay comprising photographs of the TV screen taken during the mission, it shows these images from the evening broadcast on Thursday the 17th, figure 4.3.2.12 (from my own copy) that were edited in from the Wednesday night transmissions. To emphasize further the non-
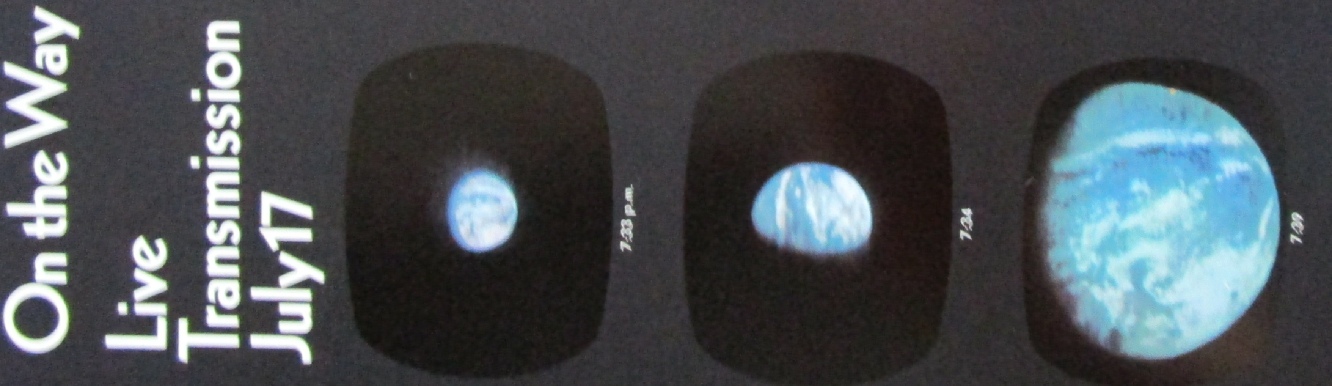
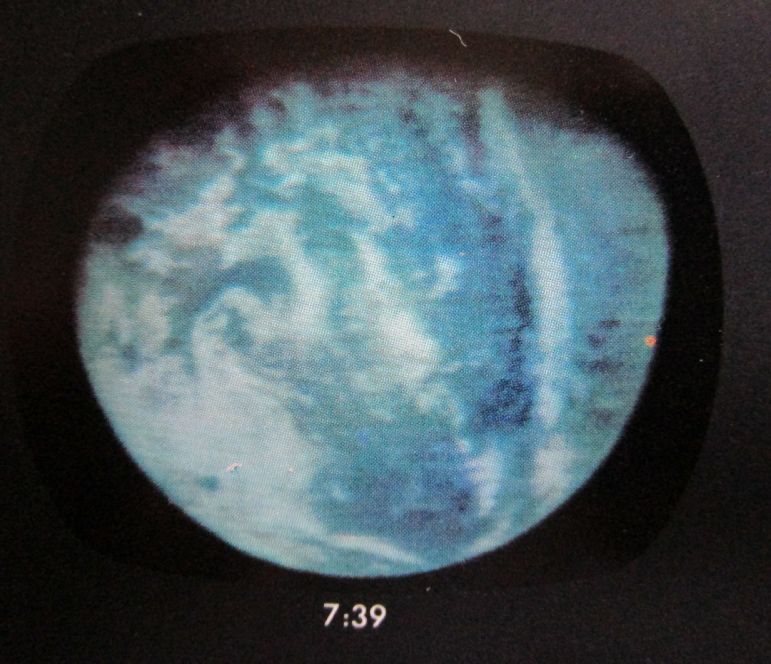
Figure 4.3.2.12: Images from CBS TV broadcast on 17/07/69. Source given in text.
In a massive display of irony, self-

Figure 4.3.2.13: The West Australian, July 18th 1969 (source) And The News from Adelaide (source)
Jarrah gets all confused by the Julian date used in the image, which clearly identifies it as being taken on day 198, or July 17th. He confirms that the newspaper would have gone to print at around 9pm on the 17th, which is 8 hours ahead of GMT, meaning that it had 12 hours to get hold of the images. In a subsequent video he tries to explain away the confusion by not knowing if January first was day 0 or not. Since when was there a January the 0th? If he’d only looked at the news broadcasts instead of relying on compilation reels sent out after the missions he might not have shot himself in the foot so badly. On the other hand, he also wouldn’t have confirmed that the TV image was taken on the day it was always claimed to have been taken and appeared in an Australian newspaper, not kept a secret. Jarrah’s later ‘explanations’ for his error are more him trying to pin the blame on someone else.
Naturally in the face of overwhelming evidence that they were not in LEO, and that the view was actually of a genuine entire Earth with temporally accurate weather patterns Sibrel’s defenders try and shift the goalposts. One of the hoax claimants makes this comment on a youtube video (figure 4.3.2.14)
Close examination of the image shows that Australia has just started to appear, which would place the photograph at around 00:45, around 20 minutes after the TV broadcast ended.
Shortly after that, a final batch of photographs shows Bernice on the terminator. One example from that batch, AS11-
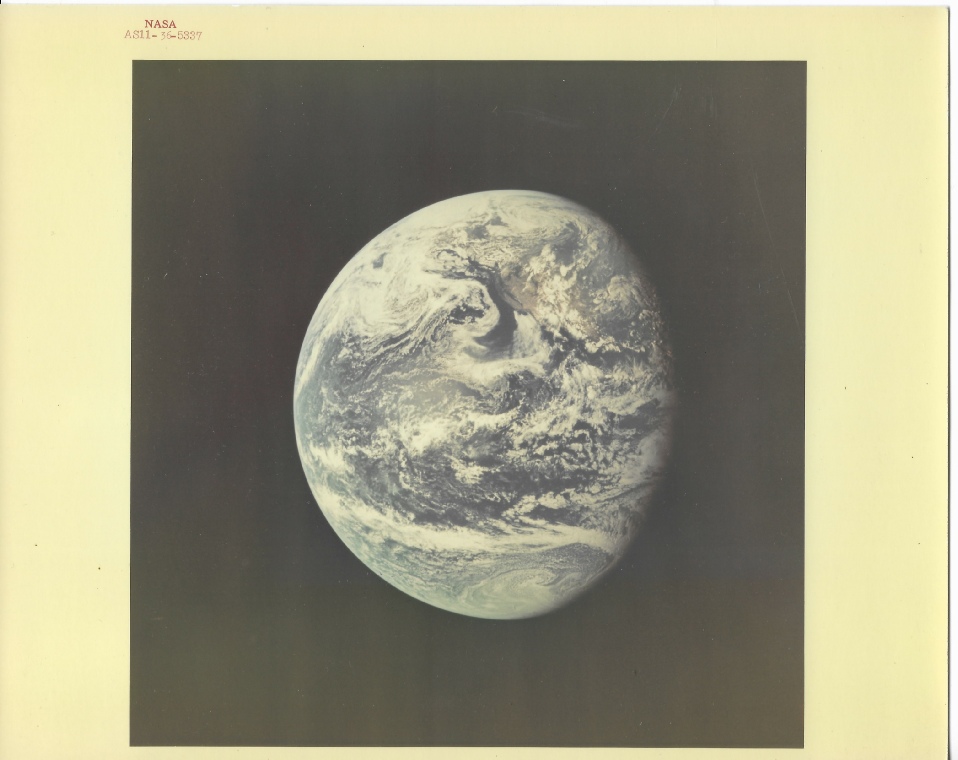
Figure 4.3.2.15: AS11-
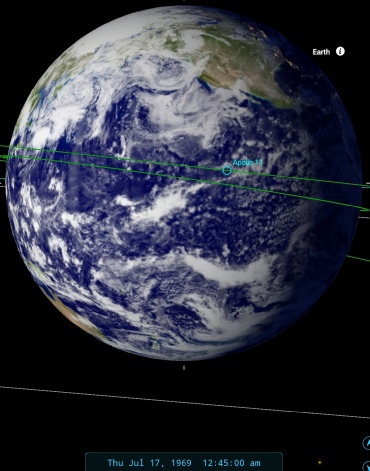
Figure 4.3.2.16: AS11-
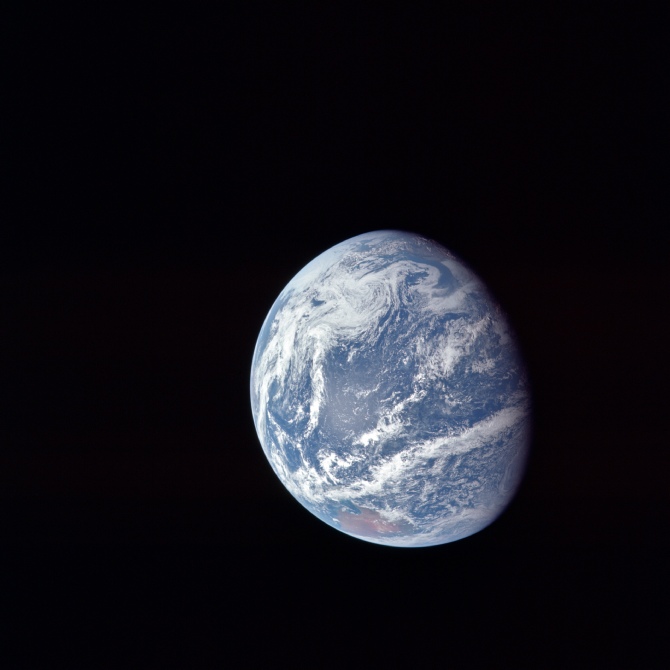
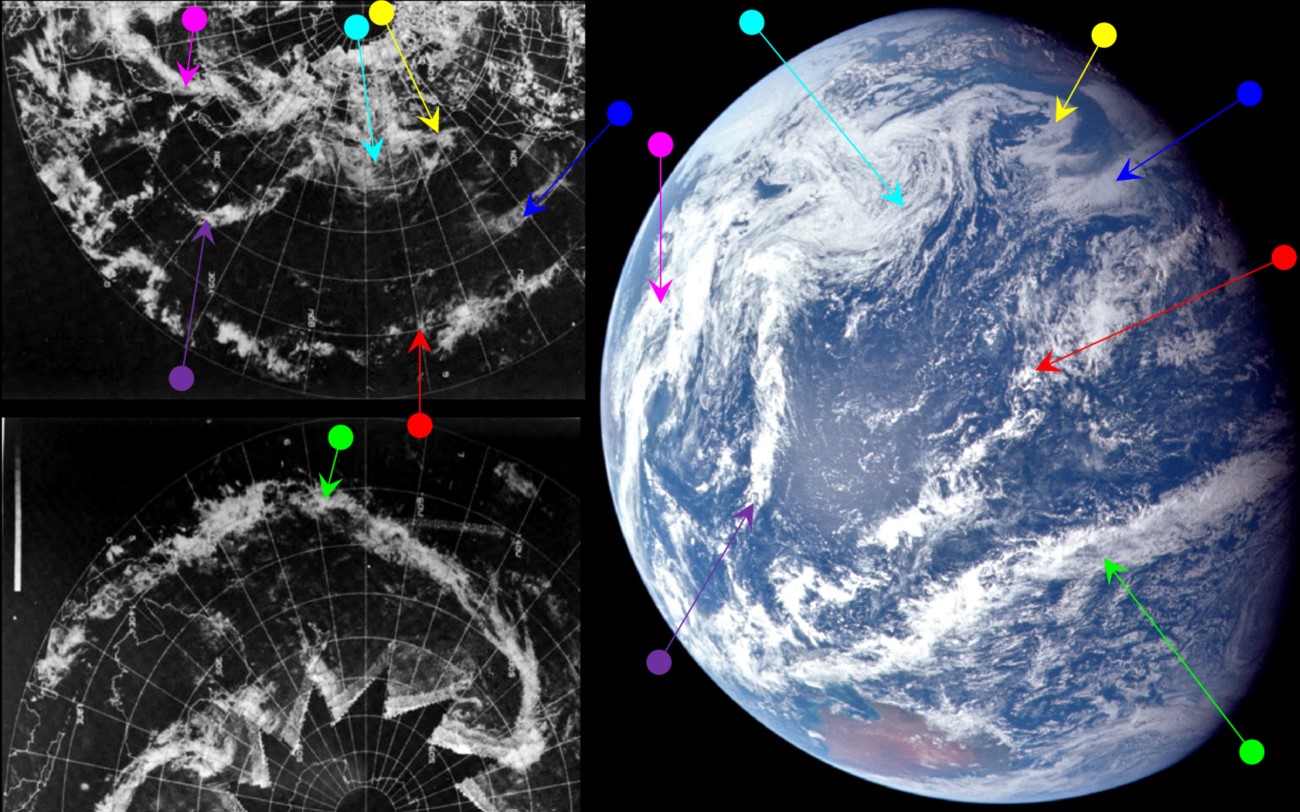
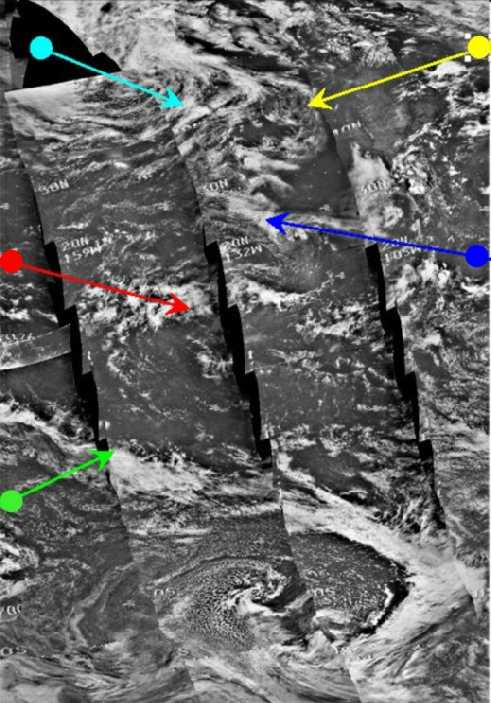
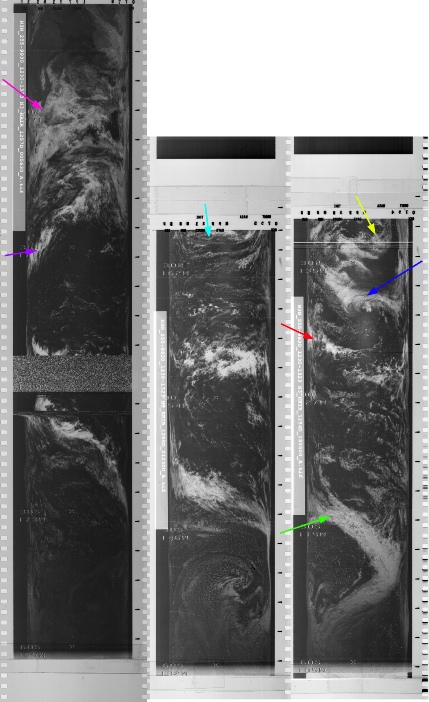
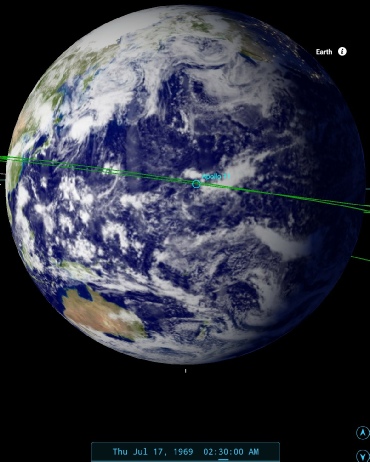
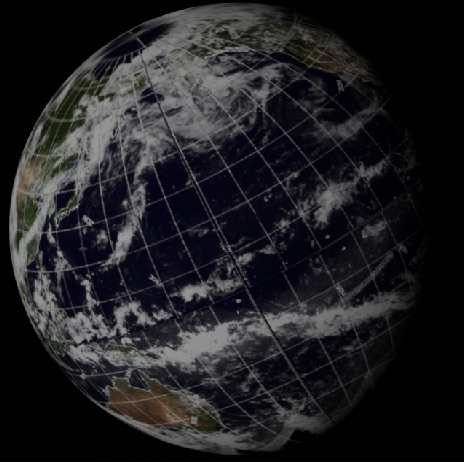
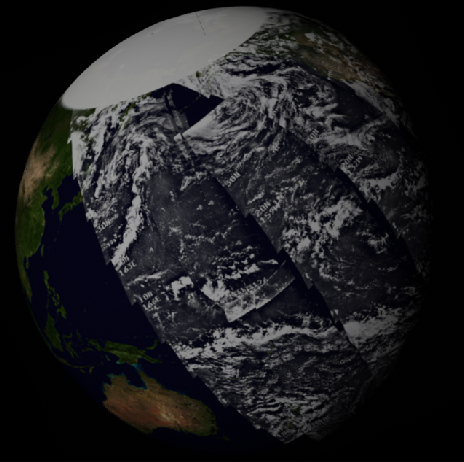
Figure 4.3.2.17: ESSA-
centret) and SkySafari time estimate.
A comparison of the terminator in AS11-
As with AS11-
The nearest ESSA track for the terminator region is still on the image dated the 16th, and was commenced at 20:07 (track 4, orbit 1755), compared with SkySafari's estimate of the time at terminator of around 02:30 on the 17th. NIMBUS' image is actually a composite of the final passes on the infra-
The image after AS11-
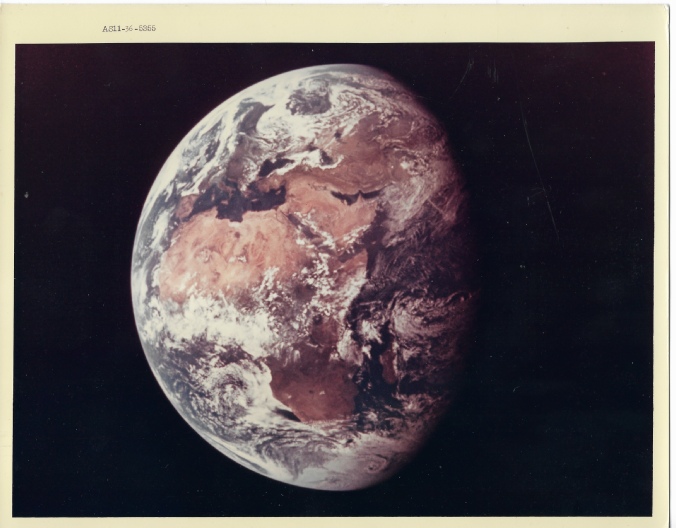
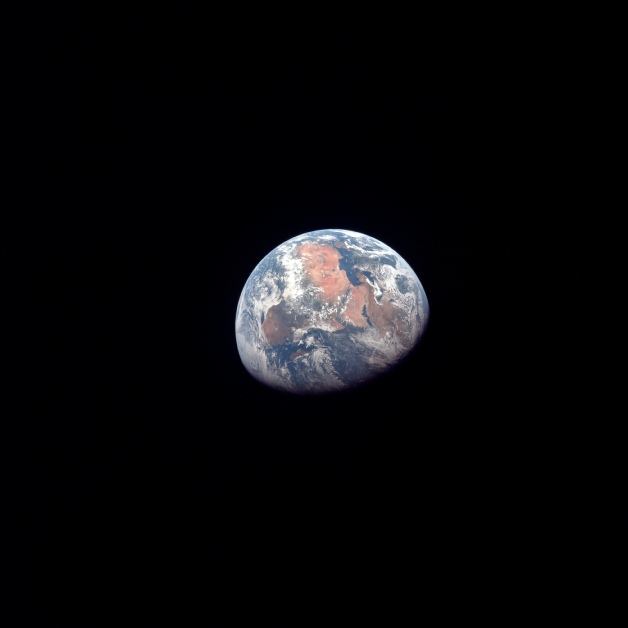
Figure 4.3.2.18: AS11-


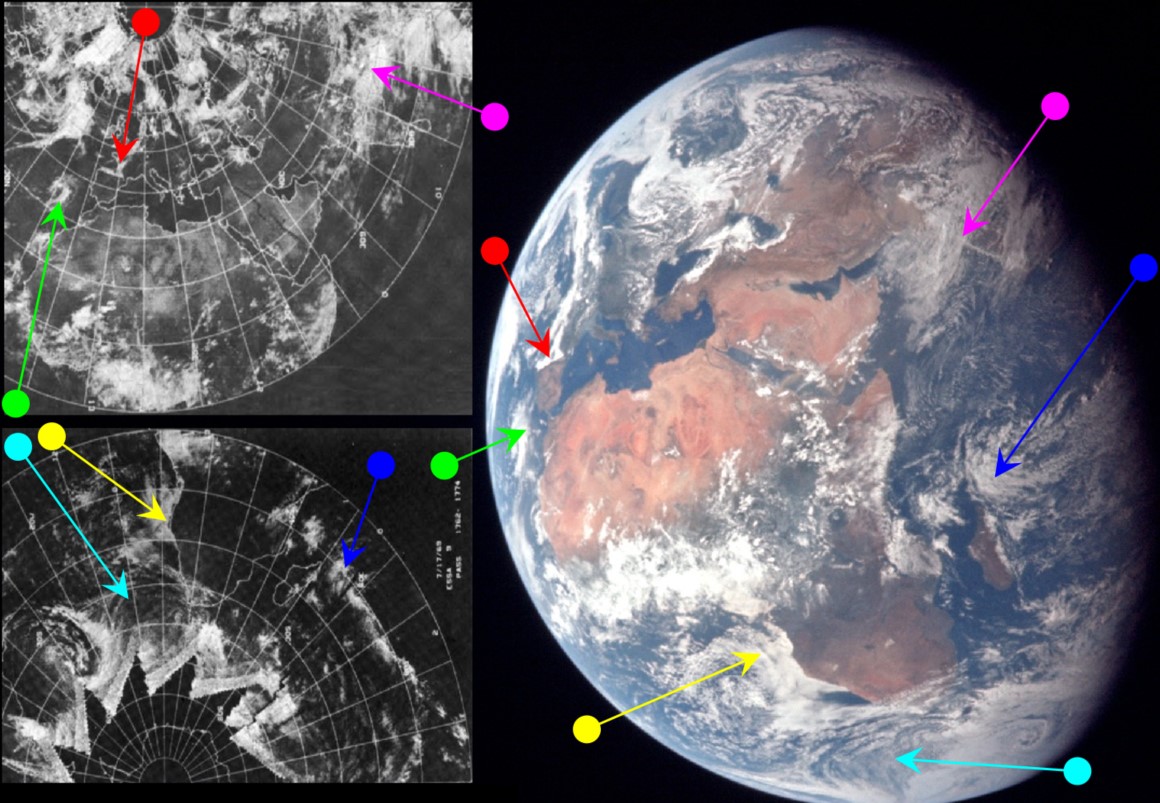
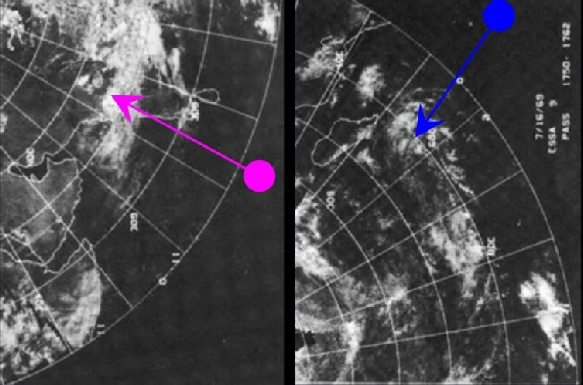
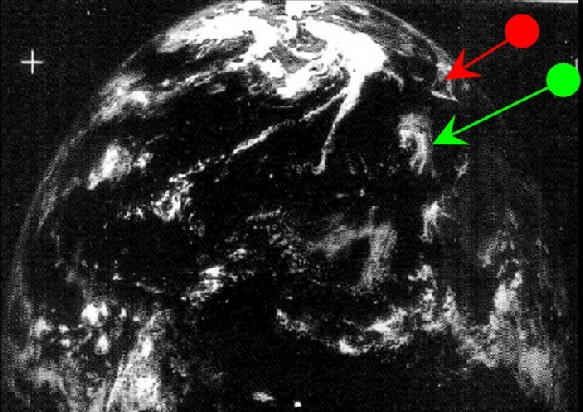
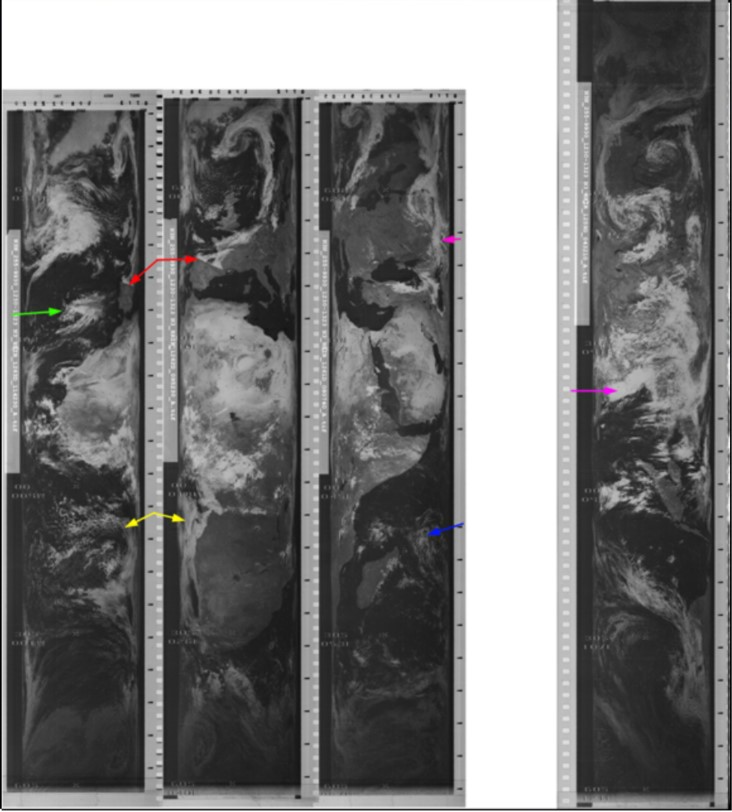
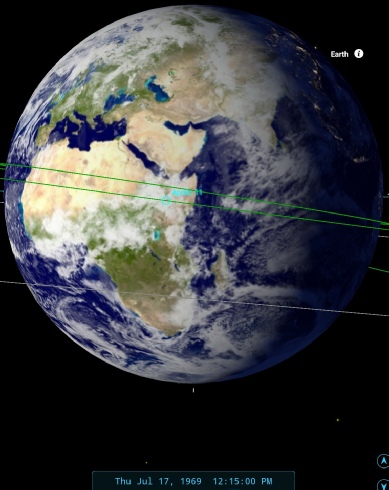
Figure 4.3.2.19: Main image shows ESSA-
Figure 4.3.2.19 is, as always where Africa is in view, complicated by the dividing line between two days’ ESSA images. West of a line stretching from around Madagascar up through the Red Sea and Eastern Europe, the ESSA mosaic dated the 17th is the most appropriate and the northern and southern hemisphere mosaics are the upper two in the top left of the figure. East of that line, the most appropriate mosaic is the one dated the 16th, as the tracks from that will have completed on the 17th, and portions of these are shown centre-
Comparison of the weather patterns identified by the magenta and blue arrows shows the difference between the two very nicely. On the Apollo image (which we know must have been taken on the 17th, and which SkySafari puts at 12:15), the clouds extending eastwards from just north of Madagascar are a wide band of diffuse thin cloud. On the ESSA image dated the 17th, this same band is a more cohesive thin band, compared with the one on the mosaic dated the 16th, which matches that of Apollo. The magenta arrow points to a cloud mass on Apollo's image that extends much further towards Arabia than can be seen in the ESSA image dated the 17th.
On the other side of the line the opposite is true. ESSA's relevant track for the terminator is number 10, or orbit 1761, which on the image dated the 16th was commenced at 08:00 on the 17th. ATS’ image is labelled as being taken on at 14:55 on the 17th, while the NIMBUS orbit nearest the terminator (pass 1259) was commenced at 05:24 on the 17th. On the other side of the globe we have a good view of Northern Europe (figure 4.3.2.20).
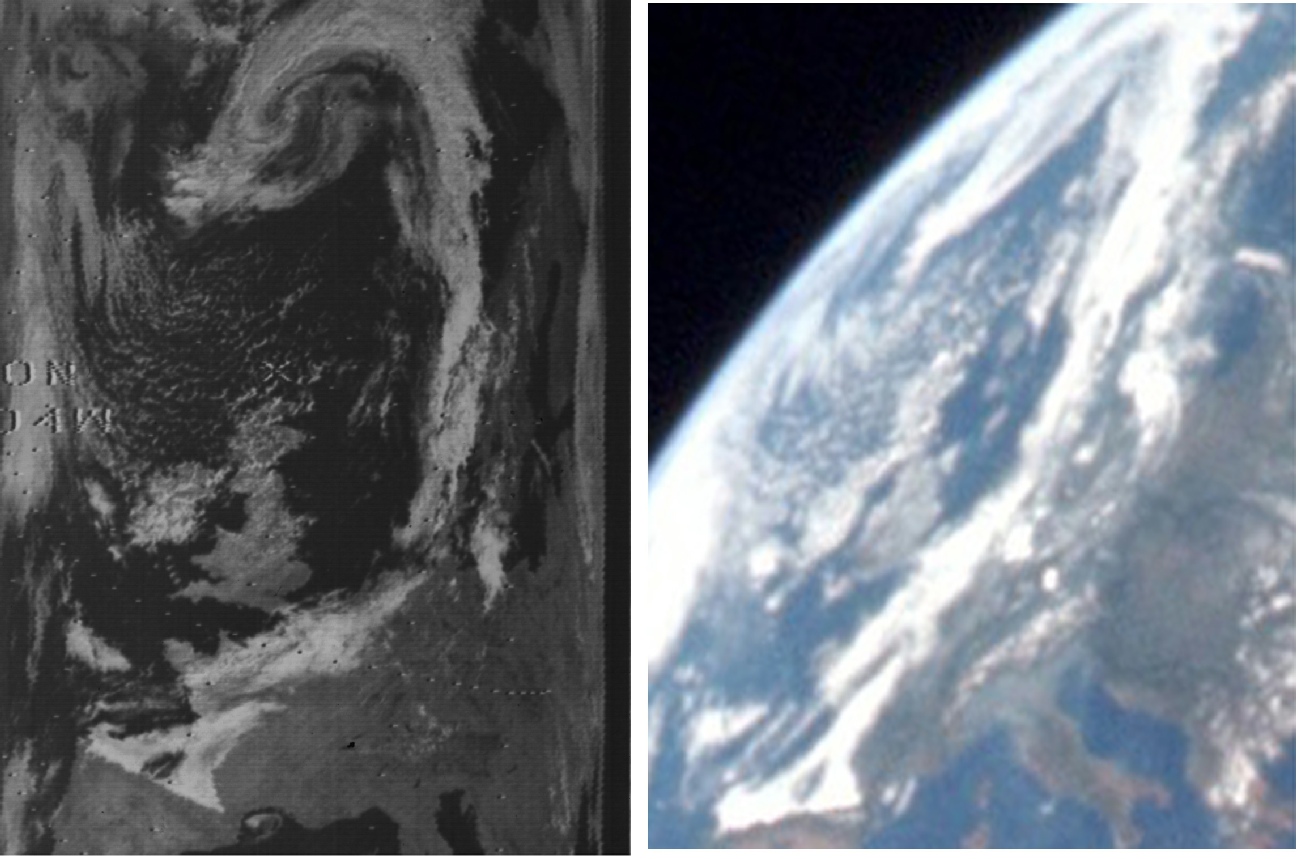
Figure 4.3.2.20: Section of NIMBUS-
The correspondence is remarkable, and at the time of the photograph no-
This youtube video tries to claim that the image is faked because it was taken on the 16th 40 minutes after launch, but his problem is that he started with the conclusion that it was faked and tried to force the data to fit that conclusion. The data speaks for itself -
Interestingly, at about that time, the mission transcript records Capcom telling the crew about the Soviet craft Luna 15, bound for a lunar landing and recorded by Jodrell Bank, but from which signals had been lost.
By the time the final image in this sequence has been taken (AS11-
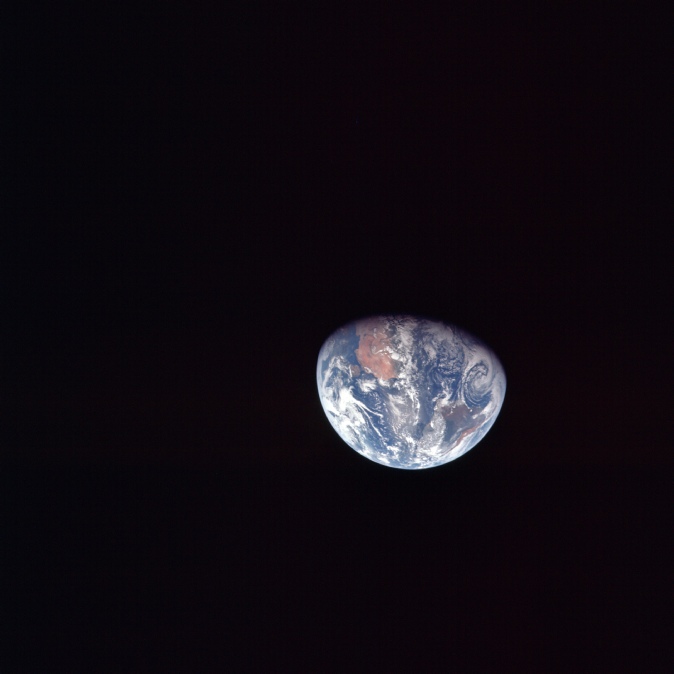
Figure 4.3.2.22: AS11-
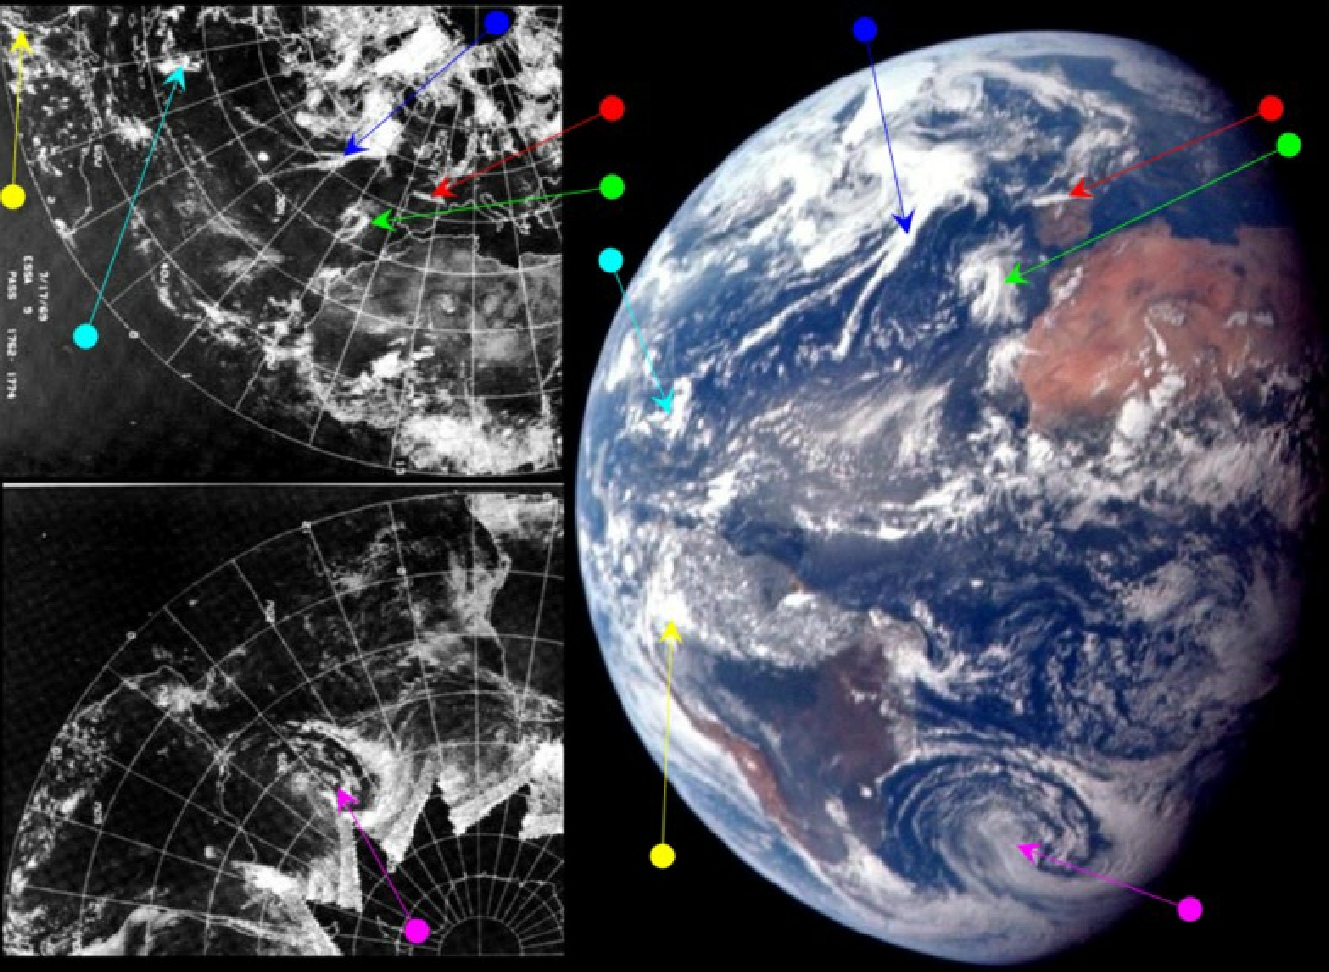
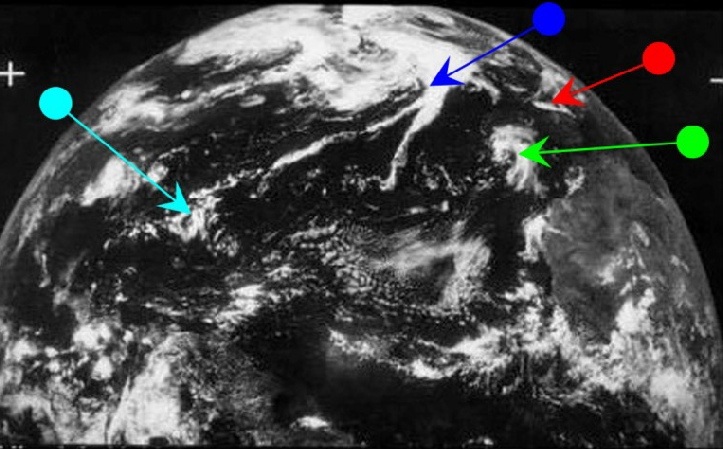
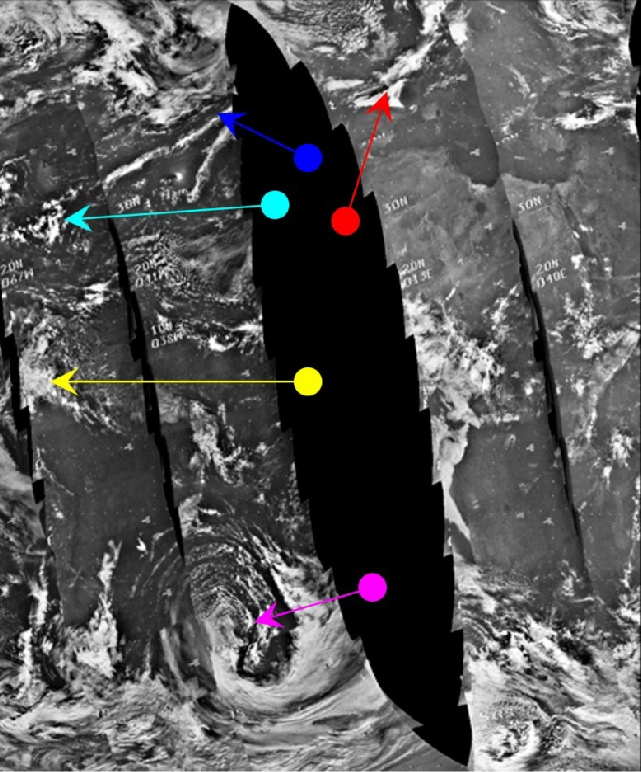

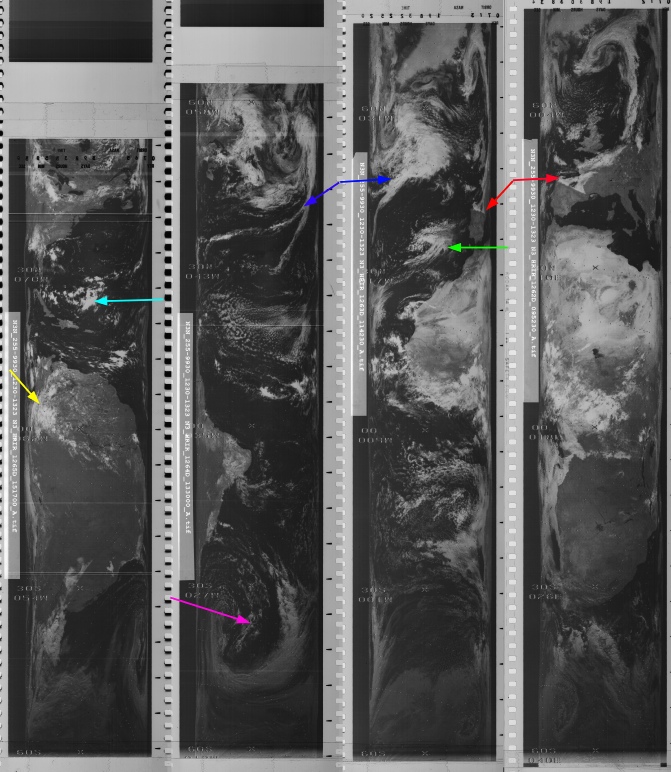
Figure 4.3.2.23: Top row: ESSA-
The red and green arrows point to the same cloud patterns as shown in figure 4.3.14. The ATS time has already been given as 14:55. The NIMBUS orbit nearest the terminator is number 1261, which commenced at 08:06 on the 17th. The Mediterranean area is actually timestamped for the IDCS image at 10:22 ESSA's equivalent orbit is number 1763 (track 12), which commenced at 12:00 on the 17th.
SkySafari’s estimate puts the time at 16:45, which is just over 27 hours into the mission. At 27h18m in the mission transcript, Buzz Aldrin describes:
027:17:09 Aldrin: Hey, Jim, I'm looking through the monocular now, and I guess to coin an expression, the view is just out of this world. I can see all the islands in the Mediterranean. Some larger and smaller islands of Majorca, Sardinia and Corsica. A little haze over the upper Italian peninsula, some cumulus clouds out over Greece. The Sun is setting on the eastern Mediterranean now. The British Isles are definitely greener color than the brownish green that we have in the islands, in the peninsula of Spain. Over.
…
027:18:53 Aldrin: Got an anticyclone going in the southern hemisphere southeast of Brazil, and some -
027:19:15 Lovell: How does the weather look up in the southern part of the western hemisphere, or up in the United States area?
027:19:26 Aldrin: Well, you all are just beginning to come over the LM now. I can see parts of Central America, and it looks to be fairly, fairly clear there. The islands in the Caribbean there, beginning to come in and rather a few streaming lines of clouds. Looks like there is a system up to the -
The magenta arrow is pointing to the storm system of Brazil, and the 'streamers' are on the system identified by the blue arrow. We therefore have an Apollo image showing perfectly the weather systems visible on satellite images, but the astronauts are able to describe the weather conditions to the ground.
About an hour or so later:
028:07:21 Collins: Rog. I've got the world in my window for a change and looking at it through the monocular, it's really something. I wish I could describe it properly, but the weather is very good. South America is coming around into view. I can see on the -
Which would match perfectly with the time SkySafari suggests AS11-
Figure 4.3.2.24: AS11-
Again, as usual, the description is perfectly accurate and consistent.
The next change of scenery in the picture sequence comes just before some photographs of the LM docking target. AS11-
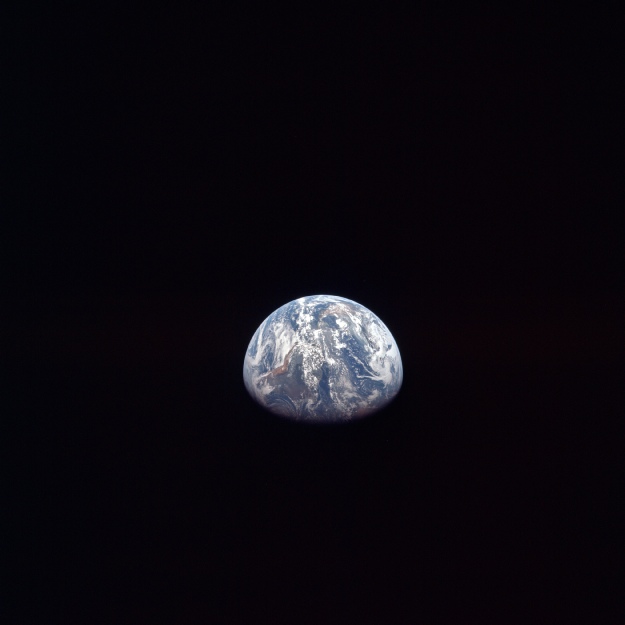
Figure 4.3.2.25: AS11-
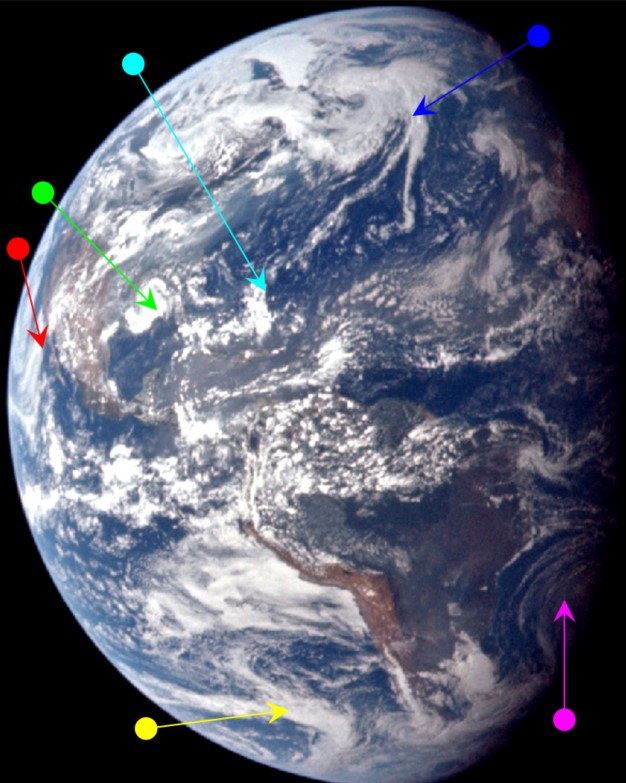

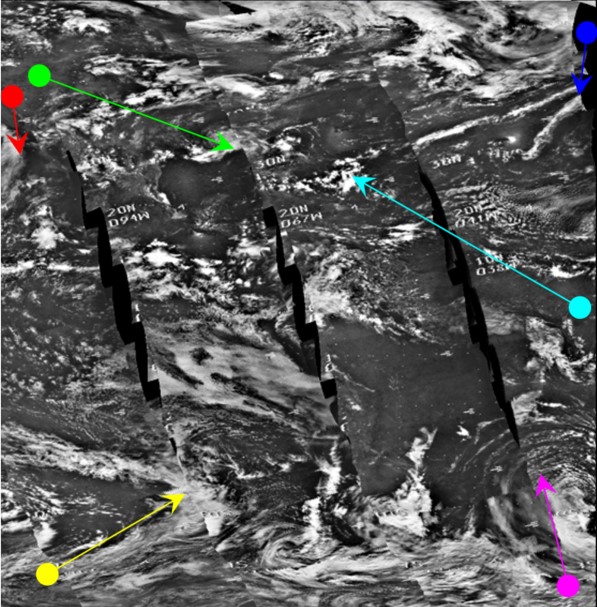
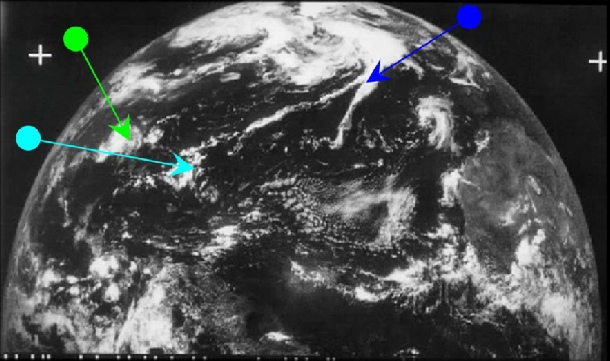
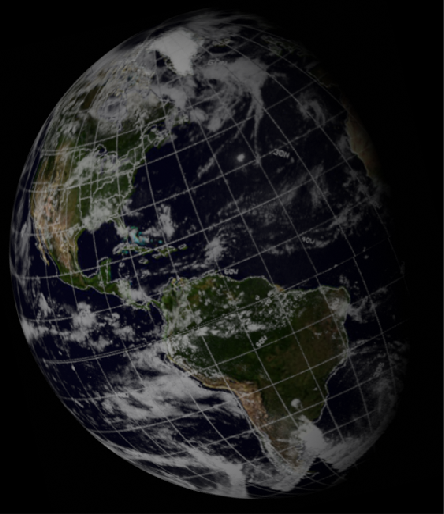
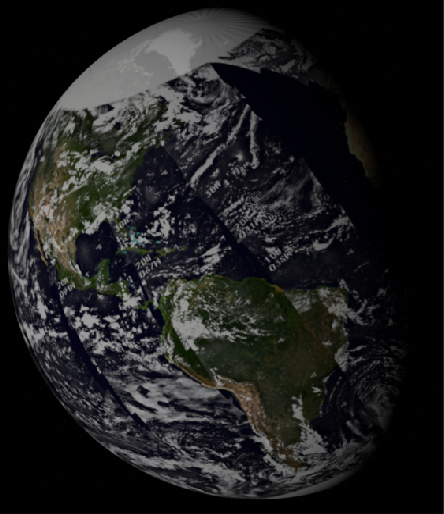
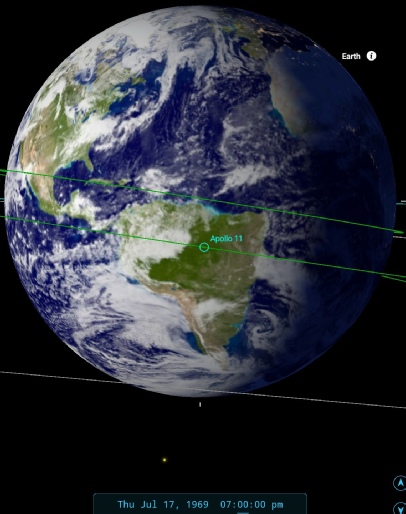
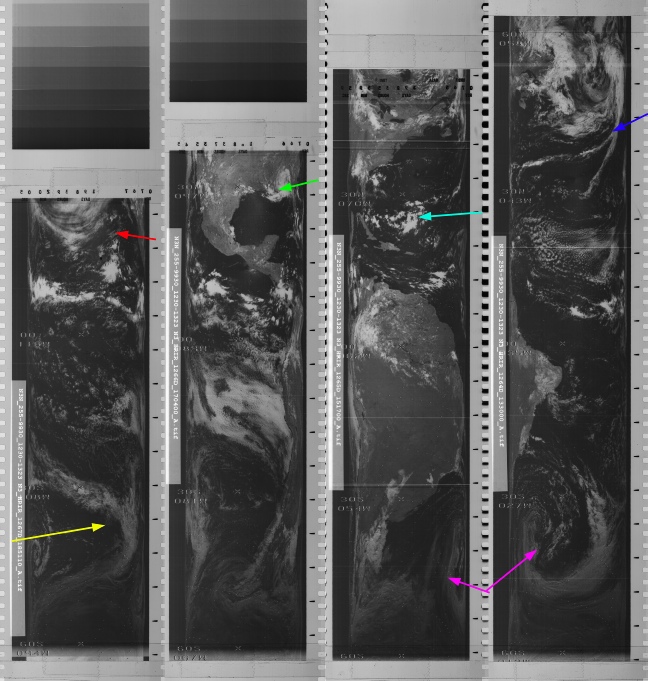
Figure 4.3.2.26: ESSA-
In the preceding figure, the blue, cyan and magenta arrows have been used to identify the same weather systems as shown in figure 4.3.18. The red arrow identifies the remains of Hurricane Bernice, just visible on the western limb.
Now that more of the USA is visible, Buzz again communicates some weather descriptions to the ground, telling Capcom:
029:33:38 Armstrong: And, Houston, we're just looking at you out our window here. Looks like there's a circulation of cloud that's just moved east of Houston over the Gulf and Florida area. Did that have any rain in it this morning?
029:33:59 McCandless: Roger. Our report from outside says that it's raining out here, and it looks like you've got a pretty good eye for the weather there.
029:34:09 Armstrong: Yeah, well, it looks like it ought to clear up pretty soon from our viewpoint. The western edge of the weather isn't very far west of you.
and this system has been identified with a green arrow, so once again we have an astronaut accurately describing the view that he could only have had from space.
The ATS image time is still the same, but ESSA's terminator orbit as moved on to number 1766 (track 2), and commenced at 17:06. The NIMBUS equivalent was commenced at 13:28 (pass 1264, with the blue arrowed storm imaged at 13:57), and both these timings can be compared with the SkySafari estimate of 19:00.
We now enter an interesting phase of the mission, because there are a couple of TV broadcasts made, with (as will we shall see shortly) contemporaneous photographs. The first TV broadcast took place as a camera test at 30:28 MET, or 20:00 GMT on the 17th. A screenshot from that broadcast is shown below in figure 4.3.2.27, and analysed in figure 4.3.2.28.
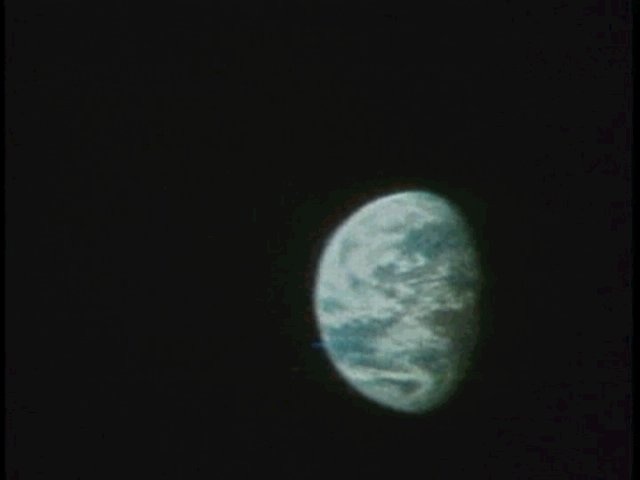
Figure 4.3.2.27: Screenshot from a camera test broadcast. Original source here: Apollo 11 TV Broadcasts
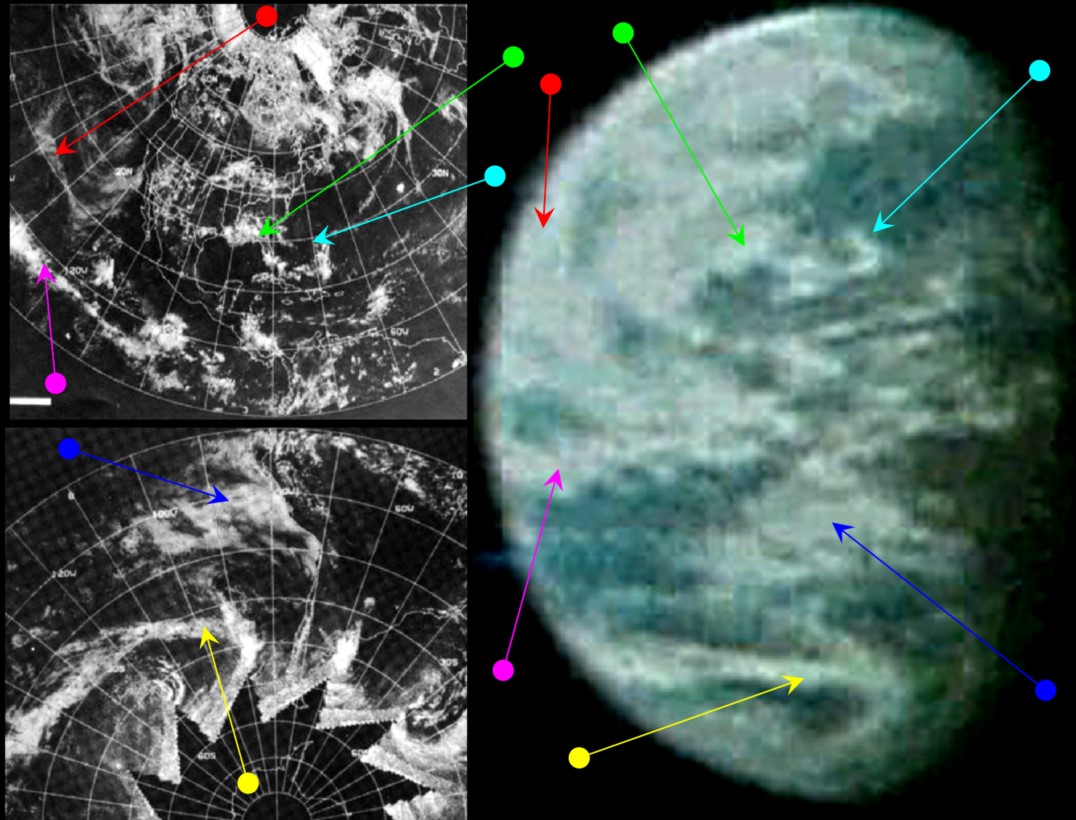


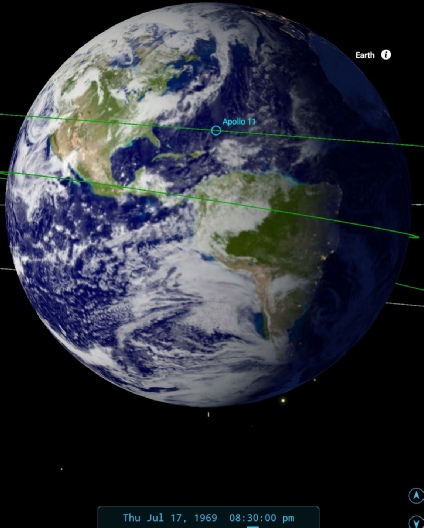
Figure 4.3.2.28: Main image shows ESSA-
The yellow, green, red and cyan arrows point to the same patterns as shown in figure 4.3.2.26. The resolution of the image has been increased and the result sharpened to improve clarity.
The camera test seems to have been unscheduled. The Goldstone receiving station in California reported to Houston that they were receiving a signal, who ask the crew about it, and to which they reply:
030:29:39 McCandless: 11, this is Houston. Goldstone reports they are receiving a TV picture coming down from you all. A little snowy, but a good TV picture. Over.
030:29:54 Armstrong: Roger. We're just testing the equipment up here.
The first images from the transmission are of the CSM interior, and the crew ask Goldstone to see if they can see any of the readings on the equipment. Half an hour later, they tell them that:
030:58:00 Collins: Goldstone should be getting about the best picture of the Earth we can give them right now, Charlie.
which puts the time of an Earth image at about 20:30. The analysis presented on the Apollo 11 TV broadcast site mentioned earlier gives the time as the start of the broadcast, but if that were the case all of South America would be visible.
What should be obvious is that SkySafari's terminator from that time shows that the Earth is in the configuration it should be for that time, and the weather systems visible in this broadcast match exactly what can be seen on the satellite images. . The long band of cloud identified by the yellow arrow is particularly prominent.
The features in the image can be seen in a photograph that was evidently taken at the same time. AS11-
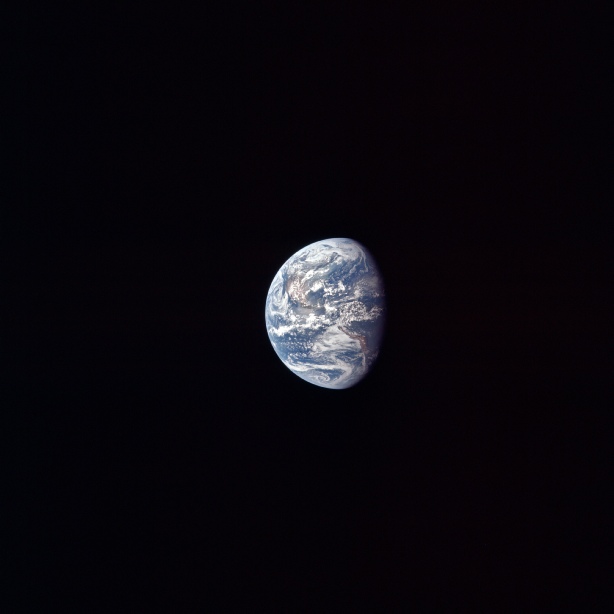
Figure 4.3.2.29: AS11-
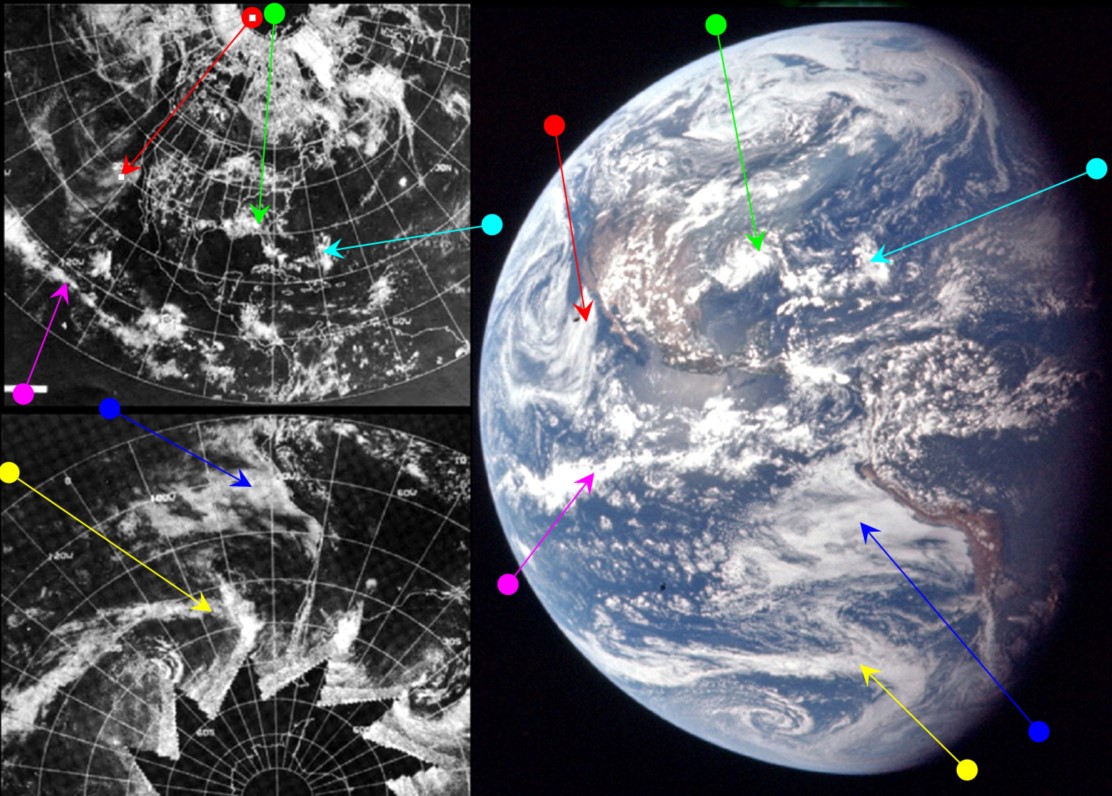
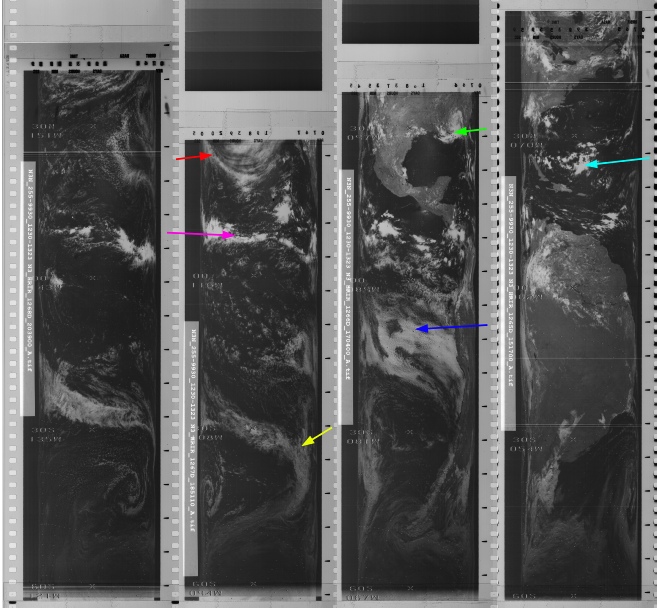

Figure 4.3.2.30: Main image shows ESSA-
It should (again!) be obvious that the features in the Apollo photograph are not just a match for the satellite weather patterns but also the TV image. The position of the terminator shows that the two were taken at almost exactly the same time, although I have added 15 minutes to the still image to make it 20:45. Although the ATS-
ESSA's terminator orbit this time is nearer to track 3 than track 2 this time, which puts the start of that orbit (number 1767) at 19:01. Likewise the NIMBUS pass is one further along, and the start of pass number 1265, which commenced at 15:15. I haven’t bothered repeating the use of the 3D models for this image, all you need to do is scroll up and you can see the match is exact.
Going back to the TV broadcast for a moment, one particular moon hoaxer (the one who claims he works for the CNSA), believes it to be a ‘smoking gun’, as shown in the repeated posts he’s made about a Bart Sibrel interview (figure 4.3.2.31)
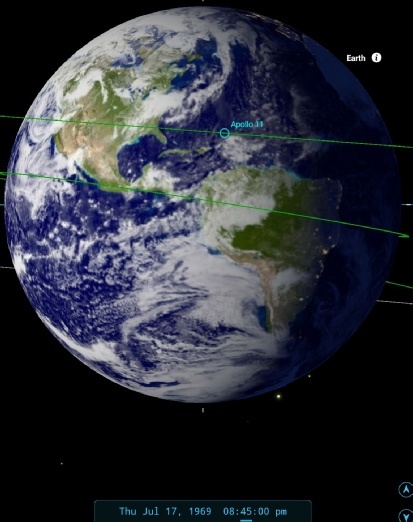
Figure 4.3.2.32: AS11-
It’s worth noting the that the SkySafari estimate coincides well with this comment in the mission audio:
031:25:59 Aldrin: That view through this sextant's fantastic. I can see Alaska right up -
The next point for analysis is the live TV broadcast, a screenshot from which is shown in figure 4.3.2.33, and analysed in figure 4.3.2.34.
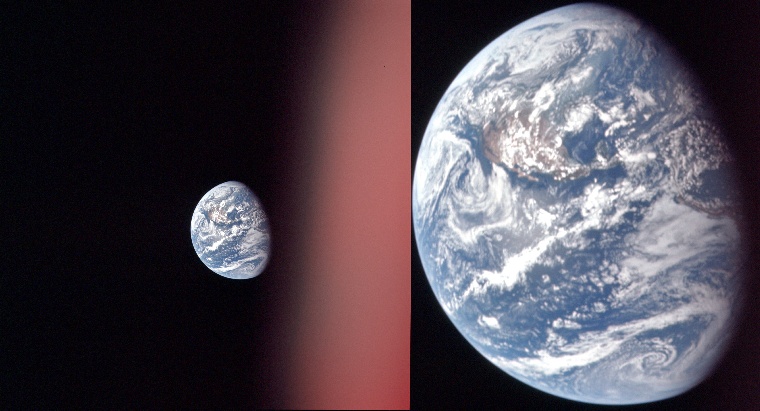
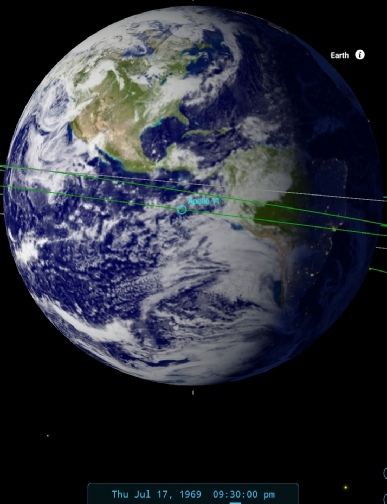
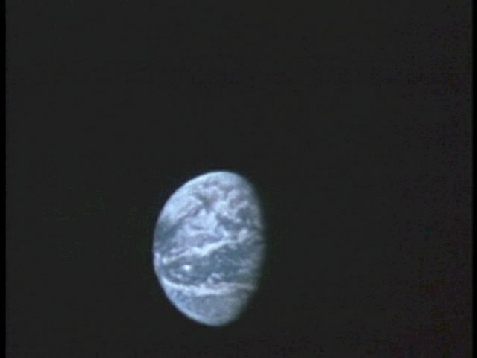
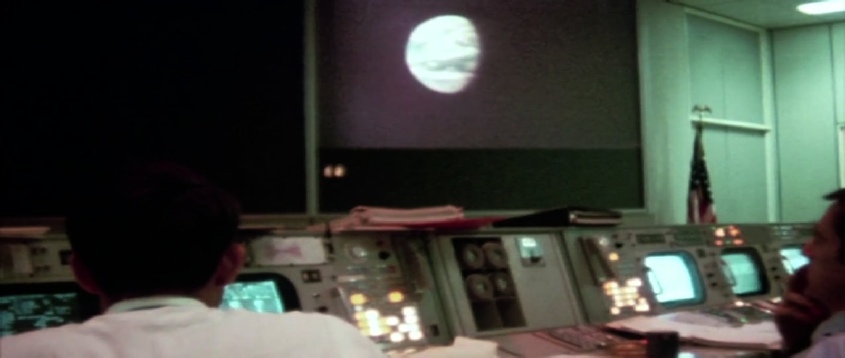
Figure 4.3.2.33: Above left, screenshot from live TV broadcast (Source), above right, the same view seen in mission control (Source). Right, photograph taken of a domestic TV during the broadcast (Source)
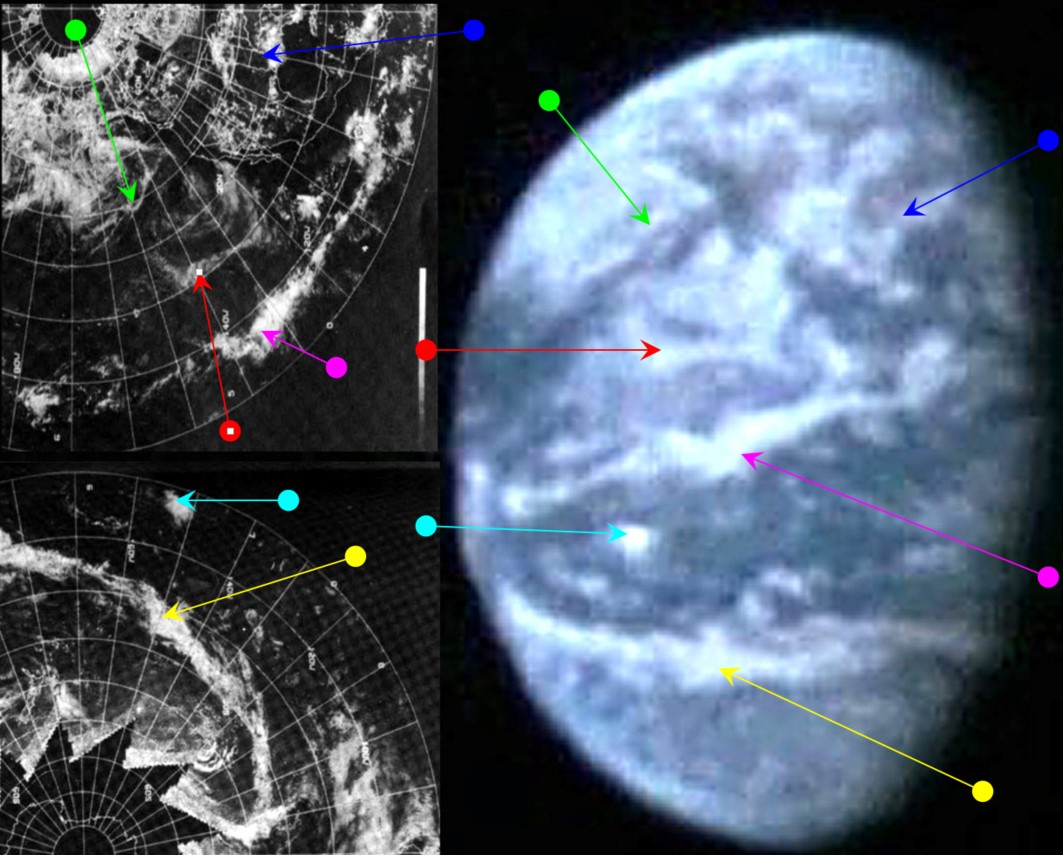
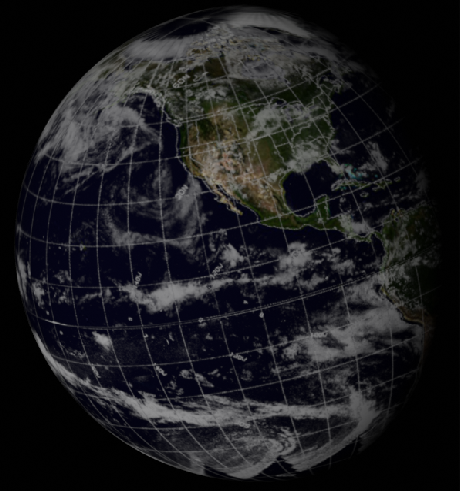
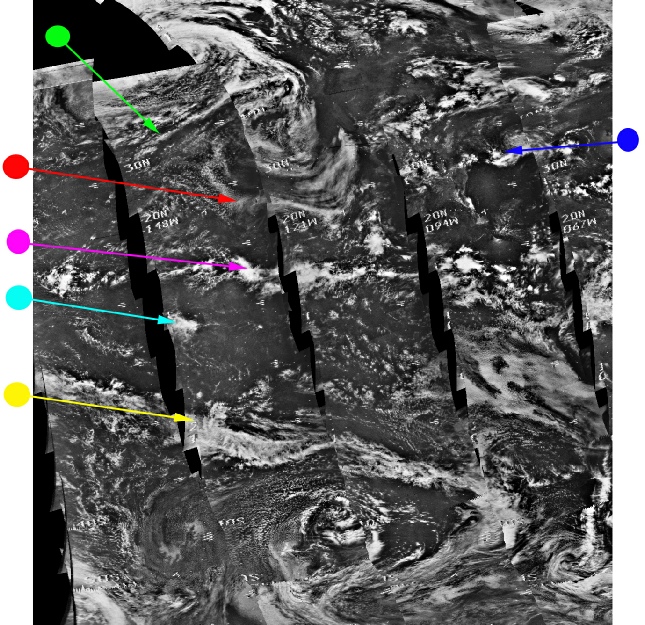
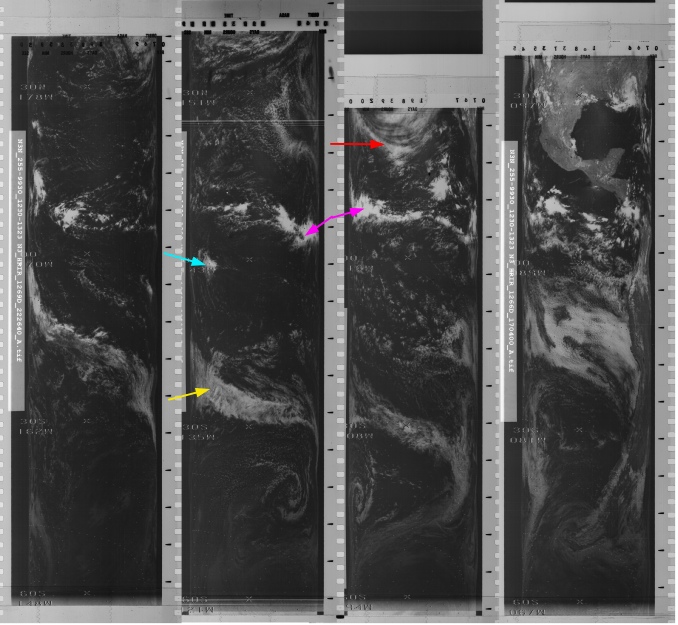
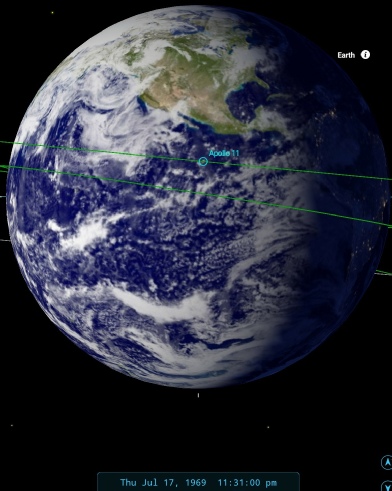
Figure 4.3.2.34: ESSA-
We are again faced with an image from Apollo that shows exactly what is visible in satellite images, and this time it is an image that was shown to millions in a live broadcast. This broadcast took place at 23:31, which is where SkySafari’s terminator has been set, and this also shows that the view is showing exactly what it should show.
ESSA's nearest terminator pass is that of orbit 1767 (track 3), which commenced at 19:01, while NIMBUS-
The clouds shown by the blue arrow was imaged at 17:28. We have more confirmations of the time from what the crew describe to the TV audience at the very start of the broadcast:
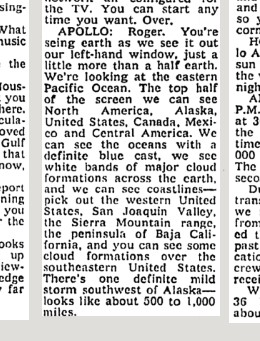
034:01:31 Armstrong: Roger. You're seeing Earth, as we see it, out our left-
034:03:44 Duke: Roger, 11. It's a pretty good picture on clarity here. We're having -
034:04:13 Armstrong: Well, yes. They cross just south of the lower part of Mexico, probably through Central America. That is the equatorial band which we assume to be the inter-
And 5 minutes later:
034:09:12 Duke: 11, Houston. Could you describe, from your view, the polar cloud cap? It appears to us to extend down the western coast of North America. Would you estimate how far it extends down? Over. [Long pause.]
034:09:50 Armstrong: It appears that the cloud cap comes down a little bit below the southern extremity of Alaska.
You might want to compare figure 4.3.2.33 with a photograph taken of a TV screen during this broadcast, published in a book in 1970, this 1969 post-
Going back to the transcripts, ss usual, what they describe is what they should be able to see. The storm to the south west of Alaska is identified by the green arrow. The cloud across the south-
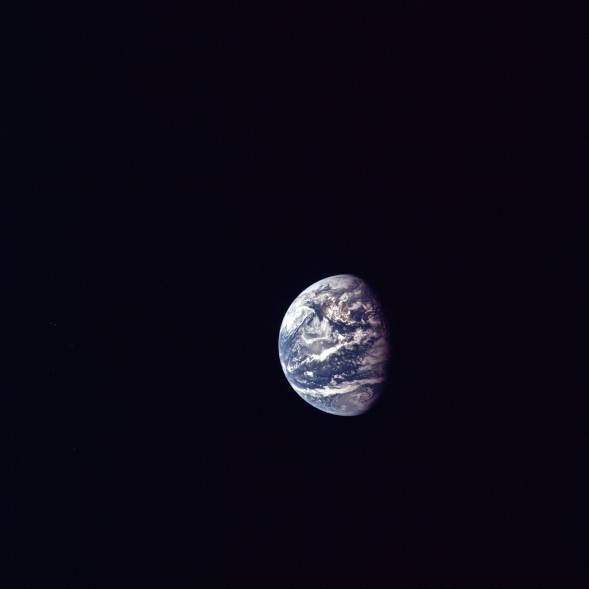
Figure 4.3.2.35: AS11-
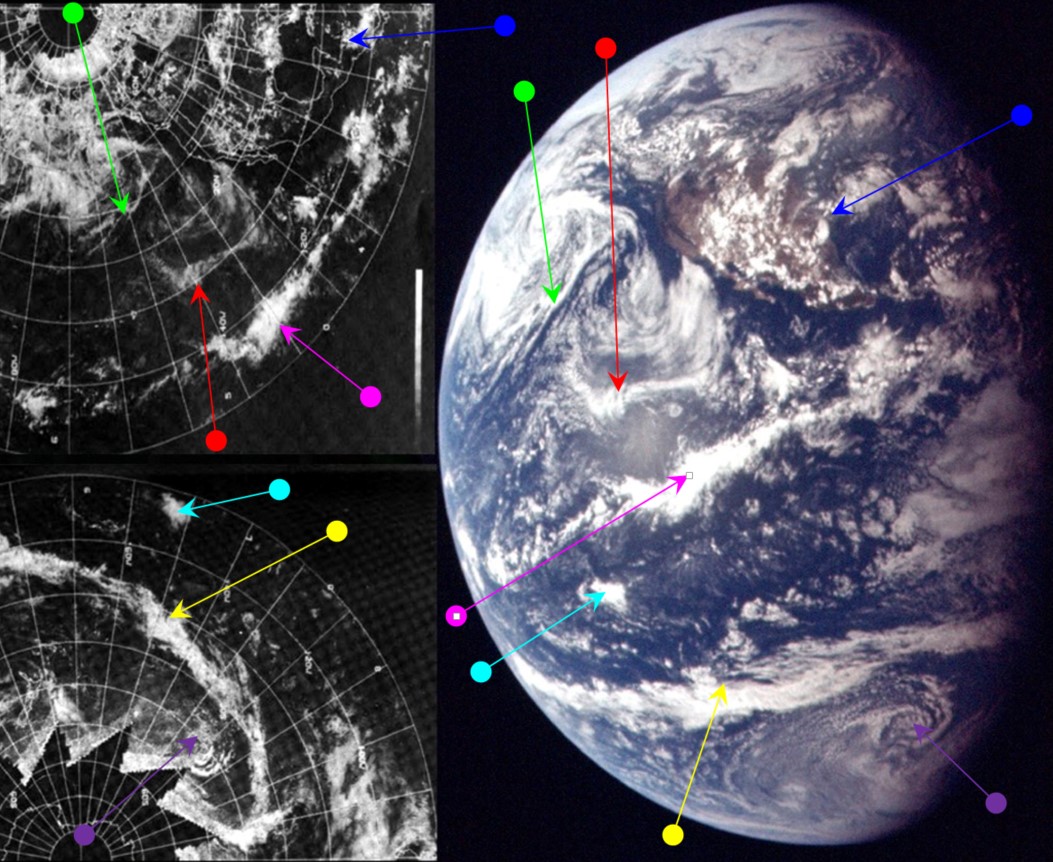
Figure 4.3.2.36: ESSA-
The position of the terminator is allowing a clearer view of north America than the TV screenshot, which suggests that the time is actually some 30 minutes before the broadcast, but it does allow a clearer view of the storm the astronauts describe to the ground.
Now that we have a clearer view of what he astronauts were looking at, it's possible to tell that the storm in the southern hemisphere to which Buzz refers is identified by the purple arrow. If the reader refers back to the TV screenshot it is possible to just make out where that whorl of cloud is pretty much on the terminator.
Because of the short difference in time between the TV image and the photograph, the ESSA & NIMBUS orbits are effectively the same for this image as figure 4.3.2.34.
There is another photograph taken during this TV broadcast that adds another dimension to the story, this time taken on Earth.
Figure 4.3.2.37 below shows a scene in Mission Control during a broadcast with Earth in view. It is publicly available in this article describing the experience of reporters during the Apollo missions, Technology Review, and is credited to NASA, but the version shown below is an original better quality dated version offered for sale on eBay. As the eBay link is unlikely to persist, there is little point giving it. The same photograph is shown as published in the Daily News newspaper, dated July 18th, along with the view of Earth itself, again showing that these images were publicly available at the time.
Figure 4.3.2.38: Screenshot from TV broadcast, 17/07/69 compared with image taken in Mission Control on the same date.
This youtuber takes issue with the live TV footage shown above, claiming that the crew are actually in geosynchronous orbit. Or Low Earth Orbit watching a video form geosynchronous orbit -
He doesn’t seem to understand that a geosynchronous orbit would not show changing land masses beneath them, nor does he seem to realise that geosynchronous orbits are considerably beyond the Low Earth Orbit he claims is the physical maximum for people.
He also seems to have a problem with Armstrong’s ability to see a large storm below Alaska (the green arrow in Figure 4.3.2.34) but not where much smaller cloud bands cross the US mainland -
034:04:53 Duke: Roger, Neil. Thank you. It also appears that just to the left of the terminator, up in the northern hemisphere, there's a cloud band trending -
034:05:26 Armstrong: I can see on the monitor the thing you're talking about, but right now I can't get my eye to the window to pick out just where it crosses the shore line.
The monitor isn’t as sharp as the view with his eye, or the sextant.
He also makes a massive strawman about Collins ‘turning the world upside down’, insinuating that they are pretending that it’s an actual spacecraft manoeuvre, when it is, and can only be, Collins turning the camera. He also claims this in the video description:
“It's important to remember this was not intended for public broadcast. However, since Bart Sibrel brought it to the attention of the world, NASA had little choice but to include the original footage in their archives.”
As we know from the fact that the images appeared all over the TV and newspapers, and the reports from journalists in the press room, and in videos and DVDs published long before Sibrel’s nonsense, this is absolutely not true. Here, for example, is the New York Times’ verbatim quote of Armstrong’s description of the view reported above (figure 4.3.2.39).
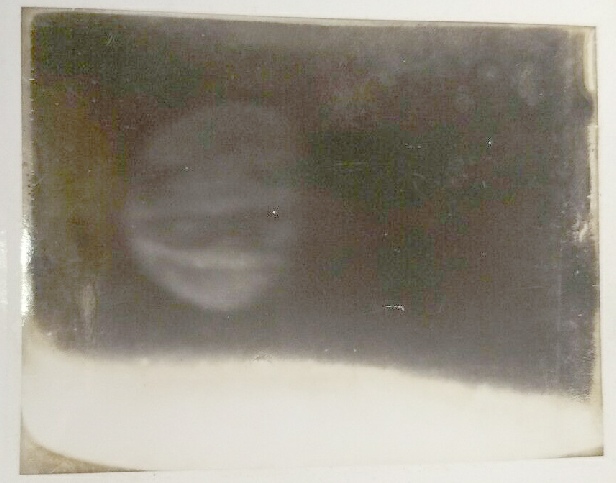
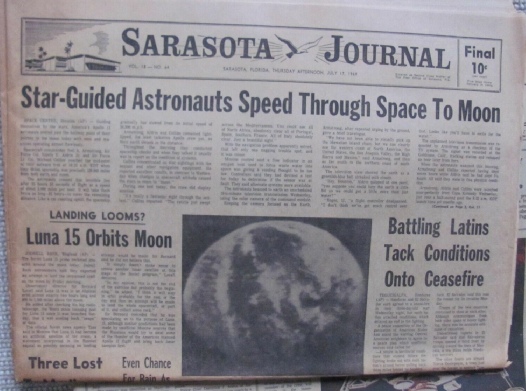
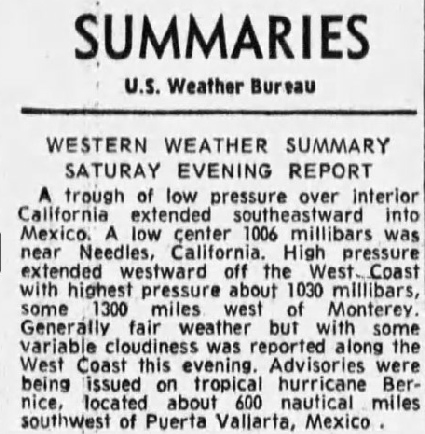
Figure 4.3.2.14: Youtube comment defending Sibrel’s “best guess”.
Turns out that Sibrel’s definitive “they were in LEO” was completely wrong, and they were using a satellite image. A satellite image that hadn’t been taken yet. In colour, when no colour satellites existed. A transparency that shows Earth’s rotation. Right. The suggestion that the timing of the transmissions is out is completely incorrect. It was a TV broadcast, not one where audio was added afterwards. It was broadcast to journalists and later the TV news. The ‘smoking gun’ so often lauded by Apollo’s critics is now not good enough. Straydog02 is quite simply wrong and clutching at straws. The only way that TV broadcast is possible is by being on the way to the moon.
At the same time as broadcasting to the world live TV images that could only be possible by being exactly where they said they were, the crew managed to get a few still photographs as well. One example is AS11-

Figure 4.3.2.39: Verbatim reports of astronaut conversations in the New York Times, 18/07/69 (Source)
His claim is that because these two images are different, they are fake. He obviously isn’t aware that there are other Apollo 11 views of Earth, that they can all be timed precisely, and that the reason these two Earth views don’t match is because they were taken several hours apart. If he compares it with one taken at the same time, ie AS11-
The next TV broadcast was a live transmission (see here for that broadcast, which some people even recorded on 8mm), and this was started at 33:59 MET (23:31 GMT). There is another image showing a slightly different view that obviously falls between the last image and the live TV, AS11-
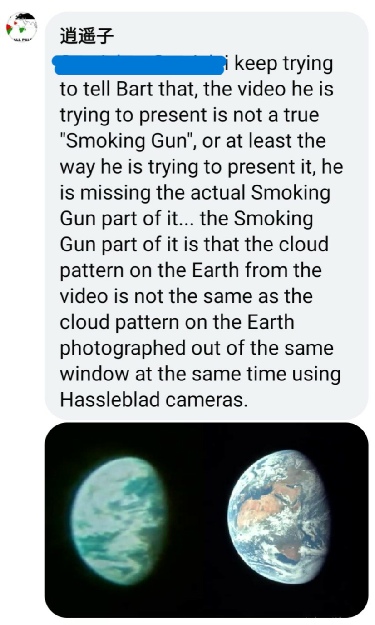
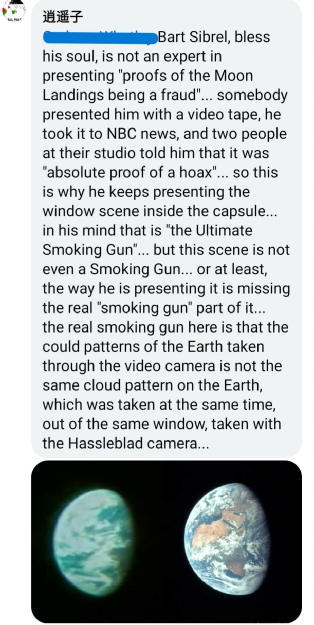
Figure 4.3.2.31: Hoax claims about the TV view from figure 4.3.26
His wild assertions about the meaning in the communications from the ground, and Collins’ facial expressions) are beyond ludicrous. He’s made several videos about Earth footage, and he fails every time to focus on the main issue: the weather, and the view of it only being possible from a spacecraft in cislunar space.
Sibrel’s claim that this, and other broadcasts, were somehow concocted n LEO is examined in detail in this excellent youtube video. In addition to pointing out the many logical flaws in the claim, the video points out that a view of Earth is shown at the start and end of the transmission, and that view is entirely consistent with the roughly 30 minutes that elapse. Figure 4.3.2.40 illustrates the point.
There’s very clear and obvious movement of landmass and weather patterns, entirely consistent with the 7 or 8 degrees you’d expect over half an hour.
In a reply to this video about his error in dating one of the broadcasts, Jarrah claims that this very clear and obvious rotation is merely a result of “video distortion”. Video distortion that causes clouds to appear at one side and disappear at the other in a manner entirely consistent with the time difference between two images? Uh-
The next still image in the magazine at the time of the broadcast shows the same view but with Florida on the terminator, suggesting a time for the photograph of around midnight on the 18th at the end of the TV broadcast. In that case. We need to move on to Day 3.
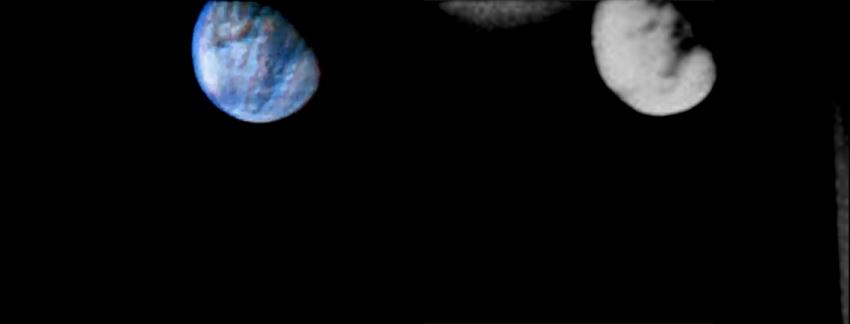
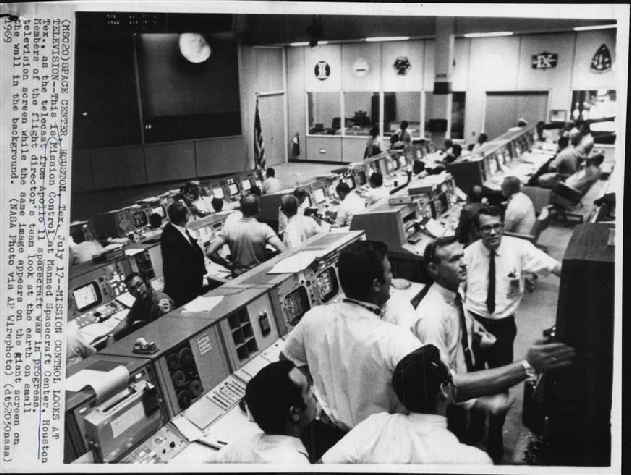
Figure 4.3.2.37: Mission Control workers gather round a screen to watch a TV broadcast (top left). Daily News photographs showing Mission Control during the broadcast and a shot of Earth itself in an edition dated July 18th (top right), Hickory Daily Record (bottom left) and New York Daily News (bottom right) dated July 18th).
This original image is clearly labelled as being from the 17th of July, but as the detail of the Earth is so poor, how can we be sure that it is from this date? The answer lies in viewing the footage. At 34:07, Collins says:
034:07:21 Collins: Okay, world, hold on to your hat. I'm going to turn you upside-
At which point he turns the camera. During that movement there is a point when the Earth appears in exactly the same position as is featured in the photograph, and this is shown in figure 4.3.2.38. Even after adjusting the levels on the newspaper image, details are still difficult to make out. However the gap in cloud off south America is easy to see, as is the west coast of north America.
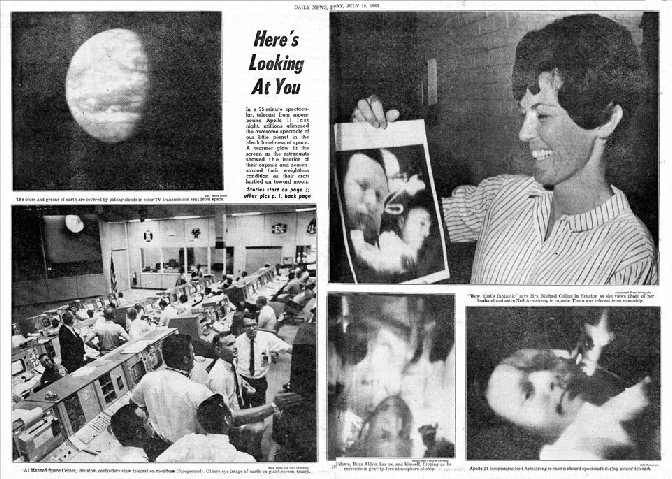
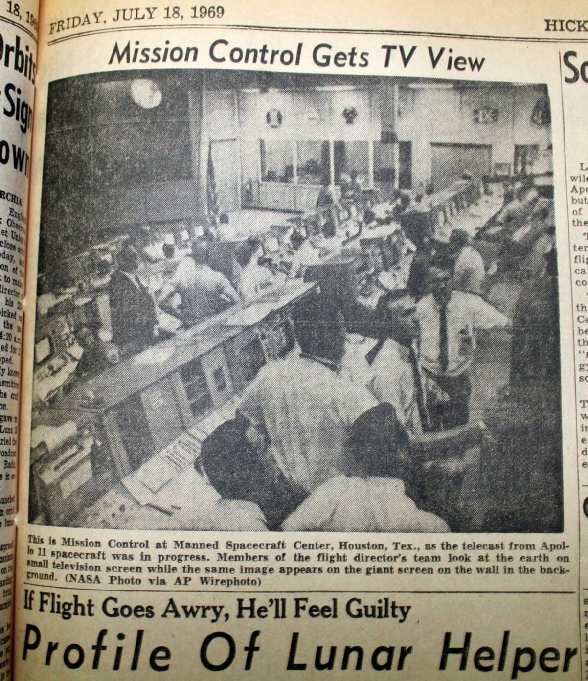
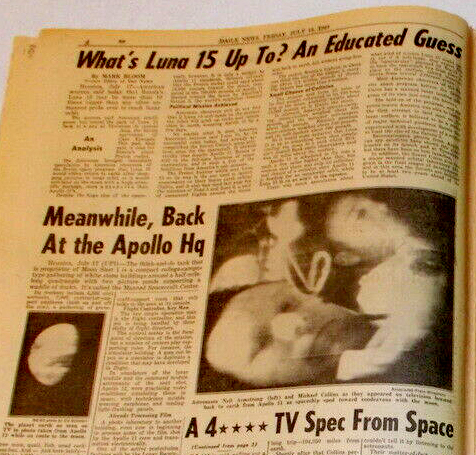
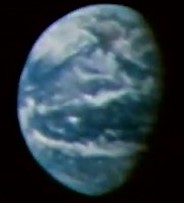
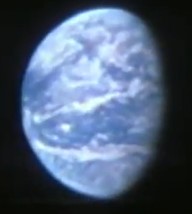
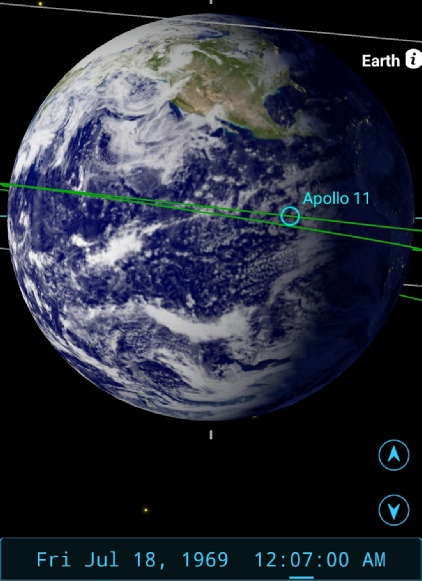
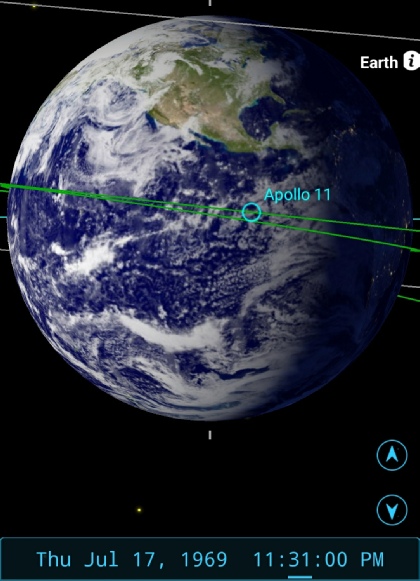
Figure 4.3.2.40: Stills from the start and end of the TV broadcast showing Earth’s rotation, along with SkySafari depictions.
The appearance of new clouds on the limb definitely shows that there has been rotation, and this image was taken roughly 15 minutes after AS11-
A short while after the previous image was taken we have an image that allows a greater contribution from the ATS-
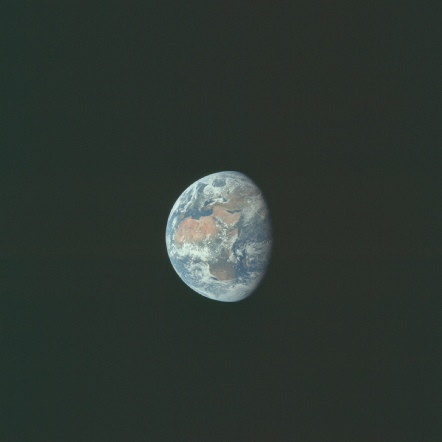
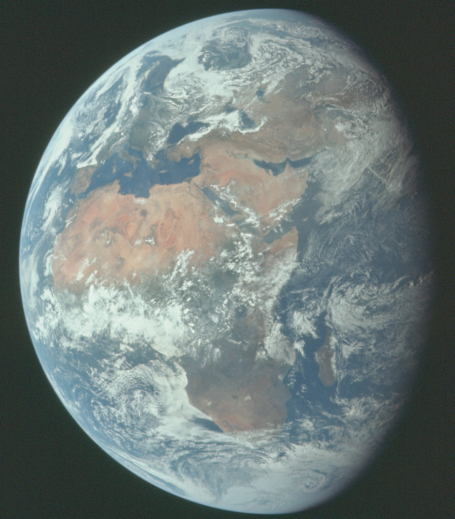
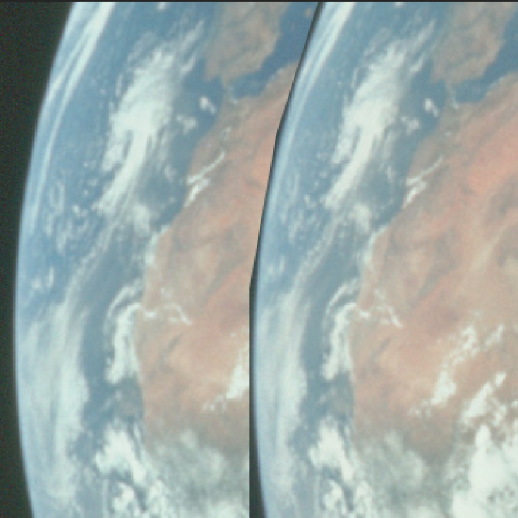
Figure 4.3.2.21: AS11-