4.3.8 -
As the crew continue home, events are unfolding in the world of satellite meteorology, and we have an interesting diversion to the story.
In 2004, the Naval Postgraduate School, amongst others, published this article. It contains an interesting and now declassified story about how naval Captain Willard 'Sam' Houston Jr & Air Force Major Hank Brandli between them managed to divert the Apollo 11 landing site to avoid potential storms that could rip the CM parachutes to shreds, killing the astronauts on impact. It is full of dramatic language, with tales of secret meetings and information from a covert satellite. This satellite contained (according to Hank Brandli) higher quality images than anywhere else (it is probably one of the DAPP/DMSP satellites described in Chapter 2).
Brandli's own website contains a version of the story here, in which it says:
“Brandl was the only person with access to this critical information – NASA's satellites weren't nearly this advanced – and he was forbidden to share what he knew.”
In what Brandli recounts as a career threatening move, he went to Captain Houston, who then went straight to the top with classified top secret data and convinced Rear Admiral (Donald C.) Davis (the man in charge of the Apollo rescue operation) that Apollo 11 was doomed, who then persuaded NASA to alter the landing area “without proof” to avoid impending disaster. According to the articles, “violent thunderstorms” were found by reconnaissance craft on the 24th (the day of the landing), vindicating the decision and Brandli's meteorological skills. According to 'Saving Apollo 11', Houston was awarded a Navy Commendation Gold Medal for his work.
Brandli's website also contains two other versions of the same events: here and here, which are copies of those published elsewhere. It is a dramatic and interesting story, but is it borne out by the evidence?
In October 1969, well before the 1995 declassification of the CORONA mission with which Brandli was involved, ESSA published one of its quarterly publications “ESSA World” (Source). In it is an article covering ESSA's support of the Apollo 11 mission, starting with the weather forecasting for the launch period, then describing their monitoring of solar flares, before finally covering weather forecasting for the landing period. An earlier edition of the journal outlines the same role for Apollo 7, and evidently satellite meteorology was a major part of the mission.
The article describes the work of the Spaceflight Meteorology Group's staff at Suitland and Honolulu (which you will recall from Chapter 2 worked for both NASA and DoD), whose job was to monitor incoming satellite images covering the target landing area, while other staff in Houston kept NASA informed of developments in the weather. On July 22nd, these meteorologists spotted a change in the weather on the satellite photos, and examination of successive images suggested relatively strong winds, 6 foot waves and the possibility of thunderstorms. The conditions were not too difficult for landing, but turbulence was a concern. To quote one of the meteorologists,
"On the basis of the Spaceflight Meteorology Group's forecasts, the end-
One of the key military contacts was a “Captain William Houston”, commander of the Fleet Weather Central at Pearl Harbour, and it seems likely that this is the same Captain Willard 'Sam' Houston described in the other articles, who held the same position and is also recorded as being the senior meteorologist for Rear Admiral Donald C Davis, commander of the Pacific Manned Space-
So, we appear to have something of a contradiction in the story. While Houston & Brandli weren't allowed to speak about their weather forecasting role in the Apollo mission, ESSA were freely discussing their own role, and seem more than convinced that they were responsible for re-
ESSA World helpfully includes two satellite images from ATS-
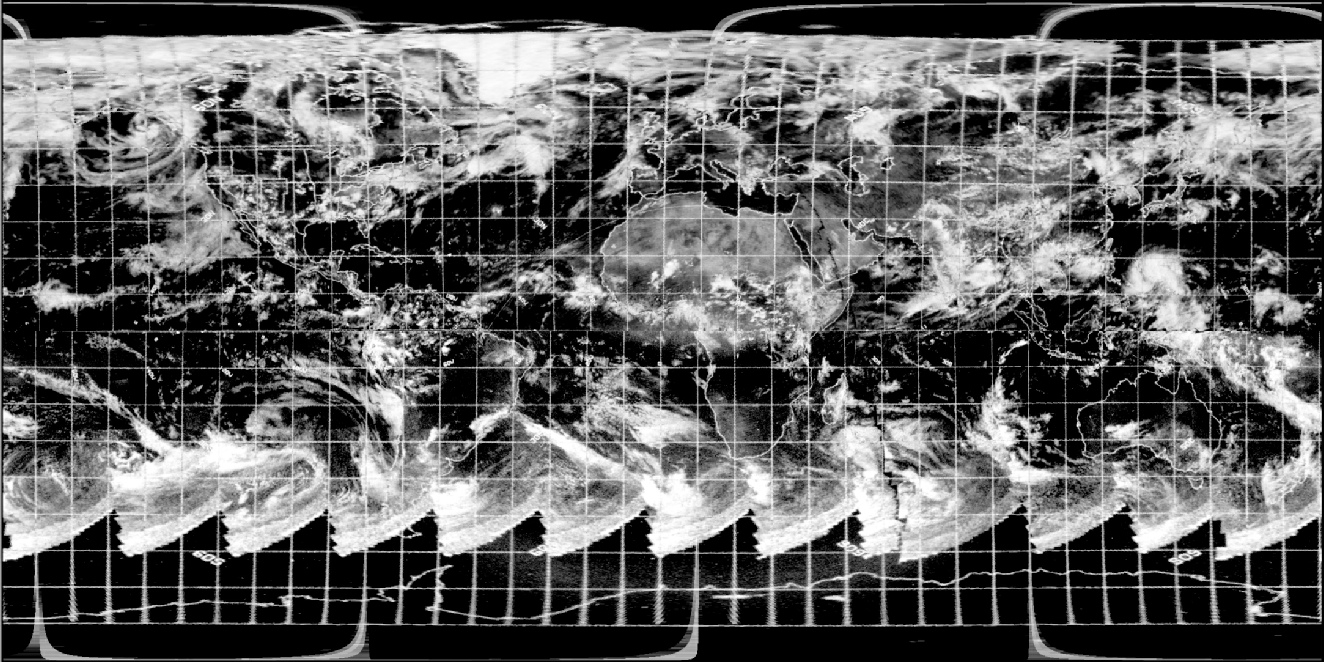
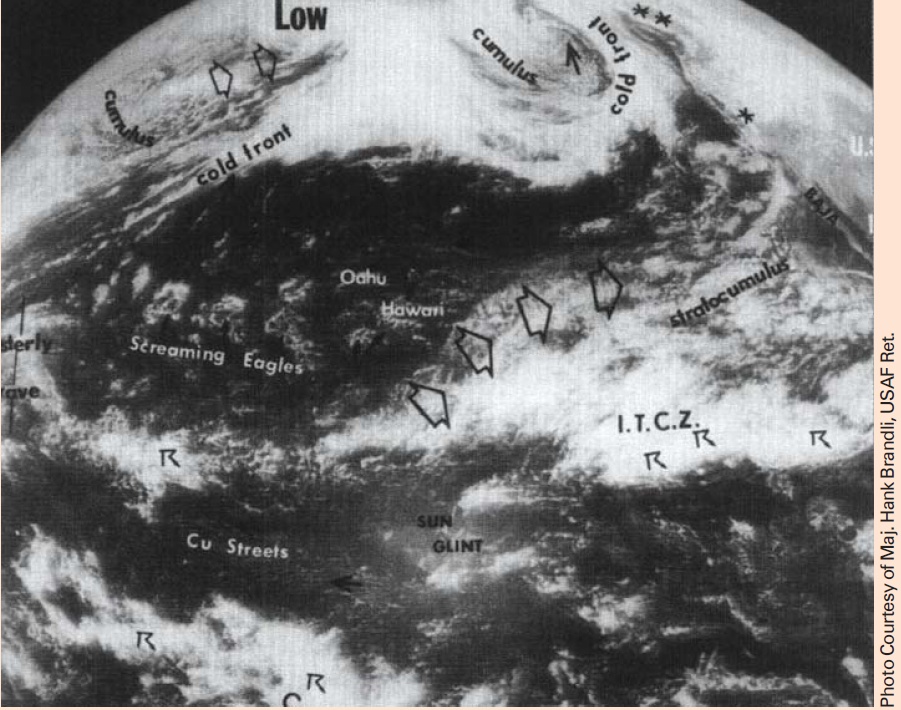
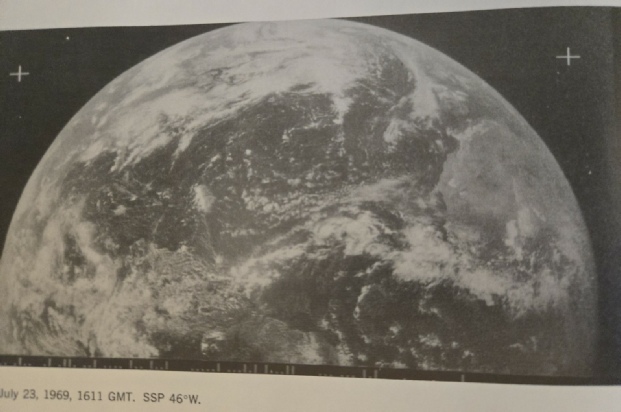
Figure 4.3.8.1: Photograph cited in this article ‘Saving Apollo 11’ . No definite date is given, and the photograph may or may not be the one cited by Brandli as being responsible for his actions. It’s more likely to be one showing the type of weather formations he described.
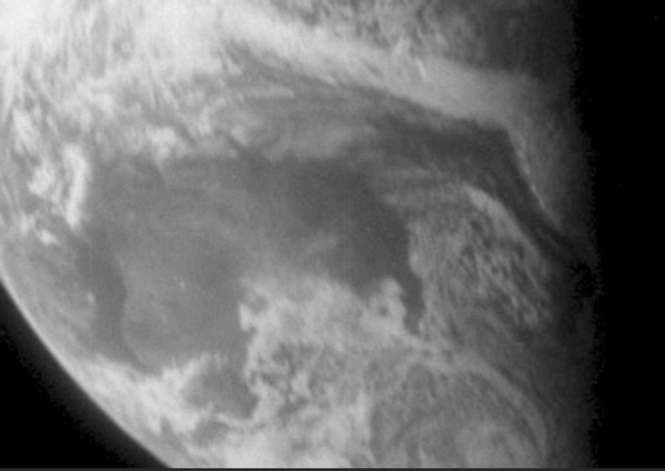
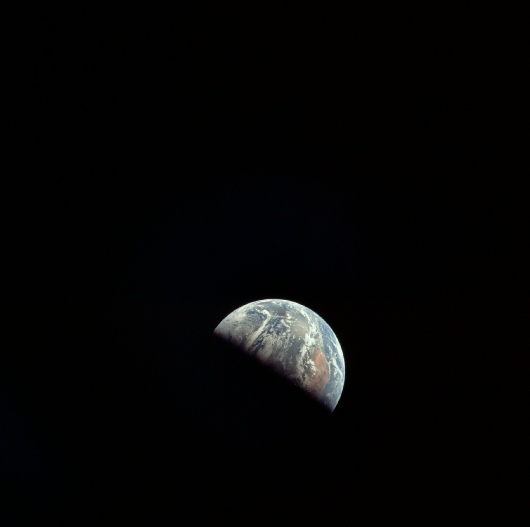
The Apollo image used is a black & white one, AS11-
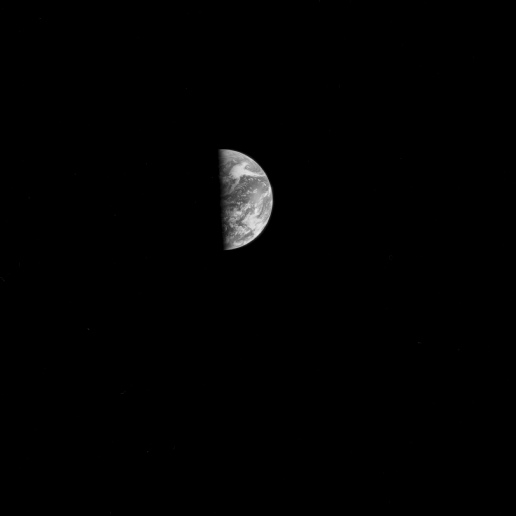
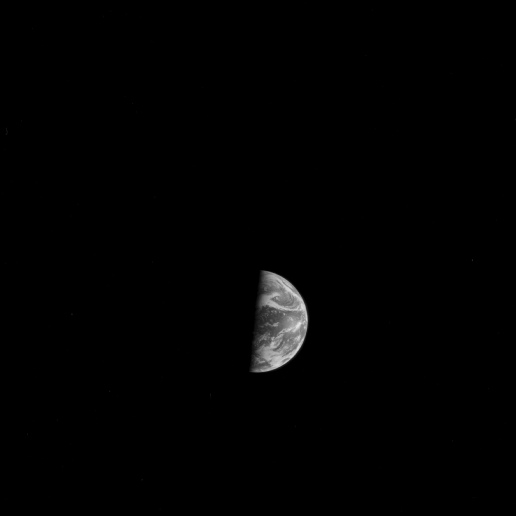
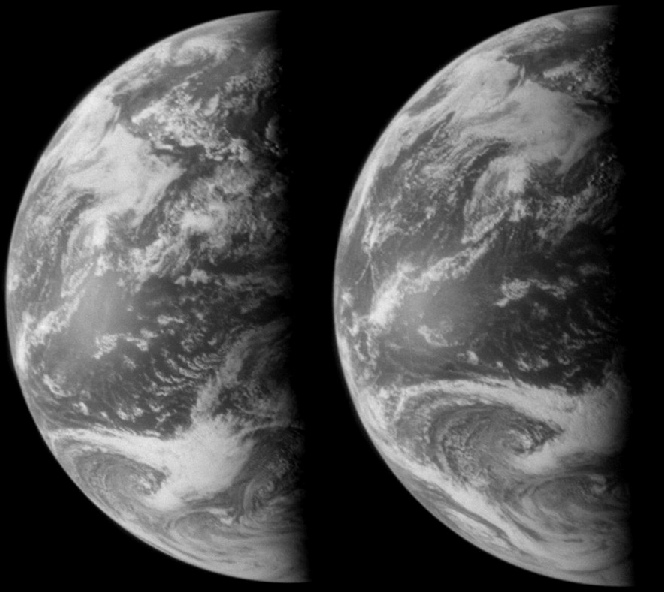
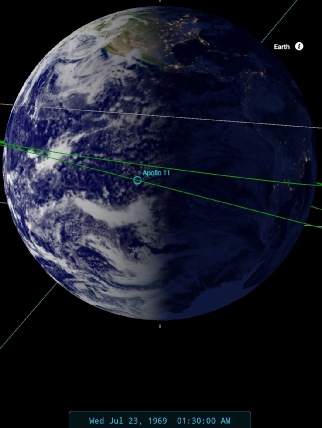
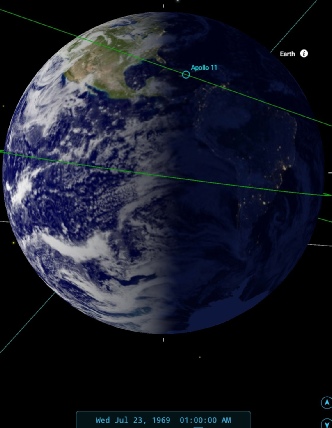
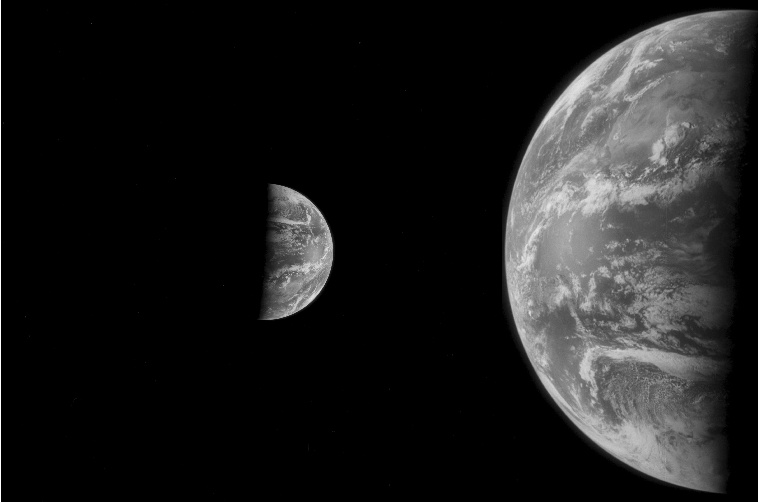
Figure 4.3.8.3: Comparison of Earth seen in AS11-
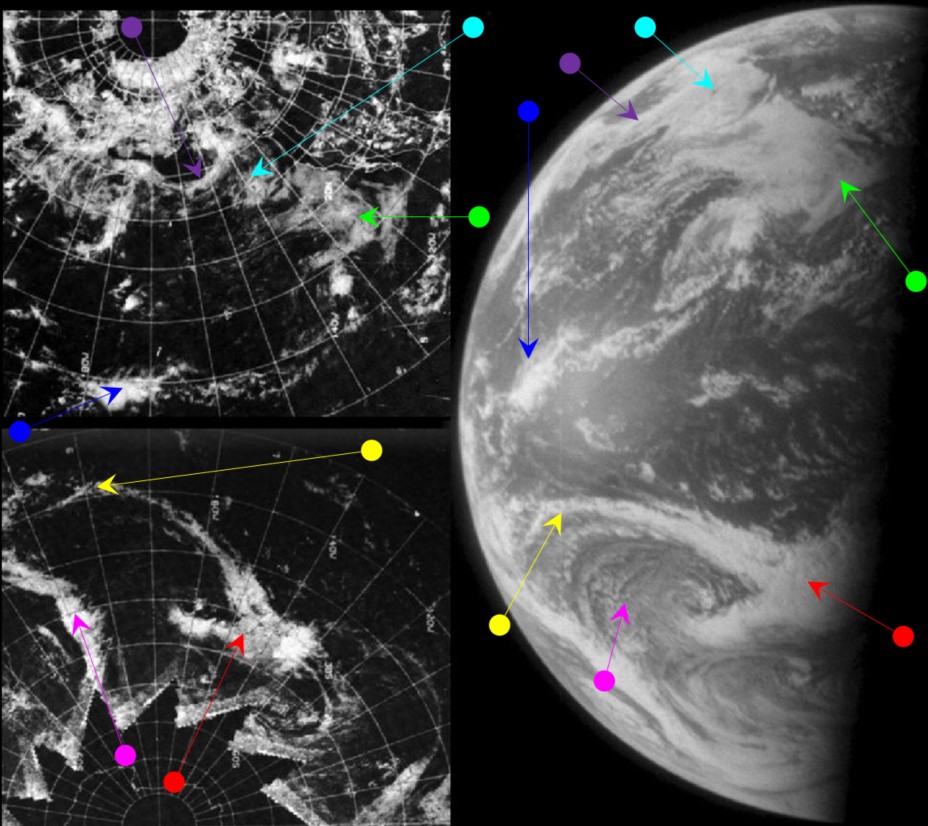
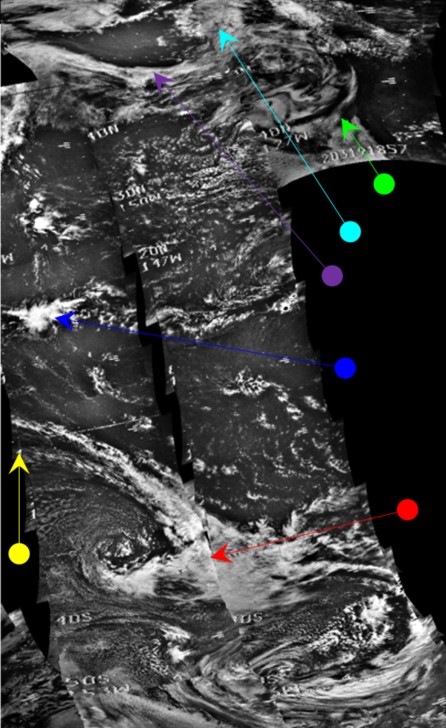
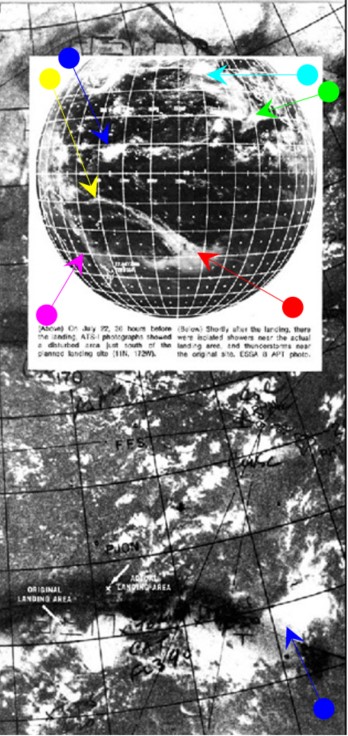
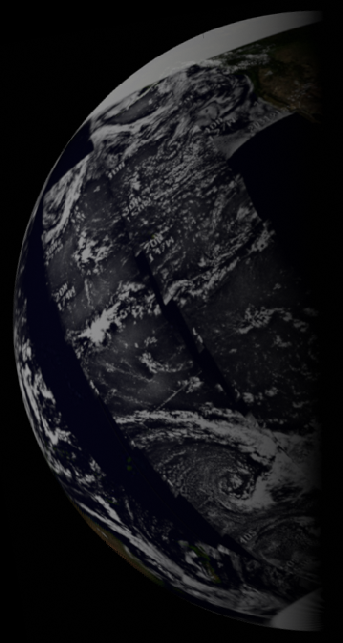
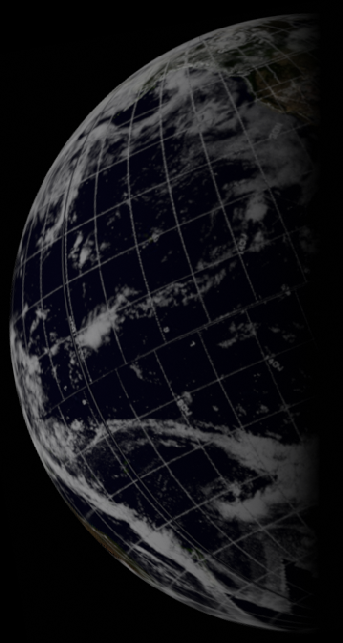
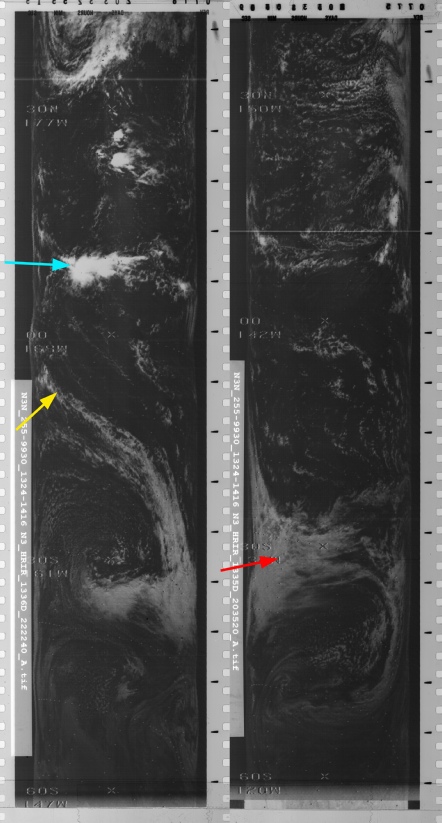
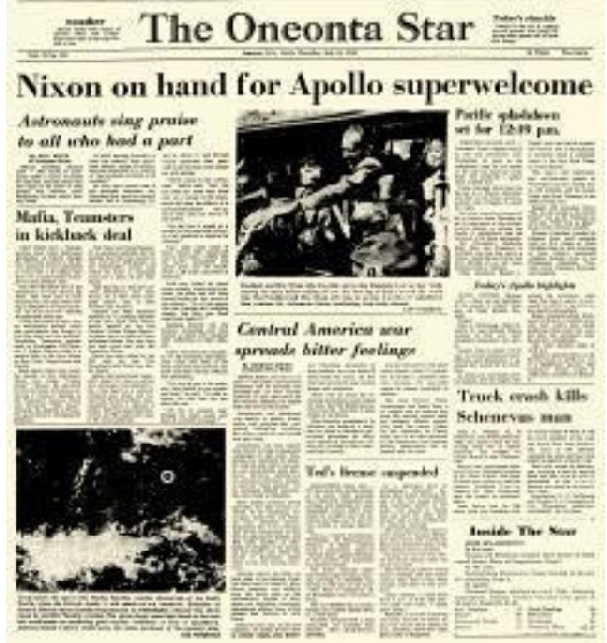
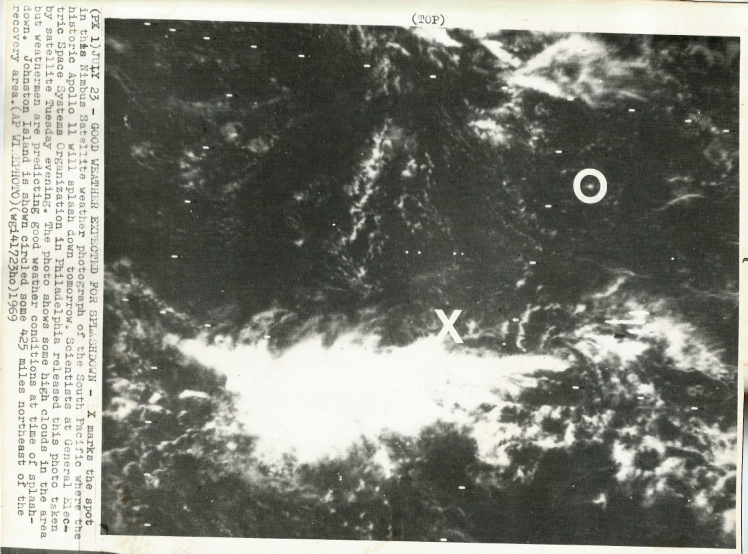
Figure 4.3.8.4: ESSA-
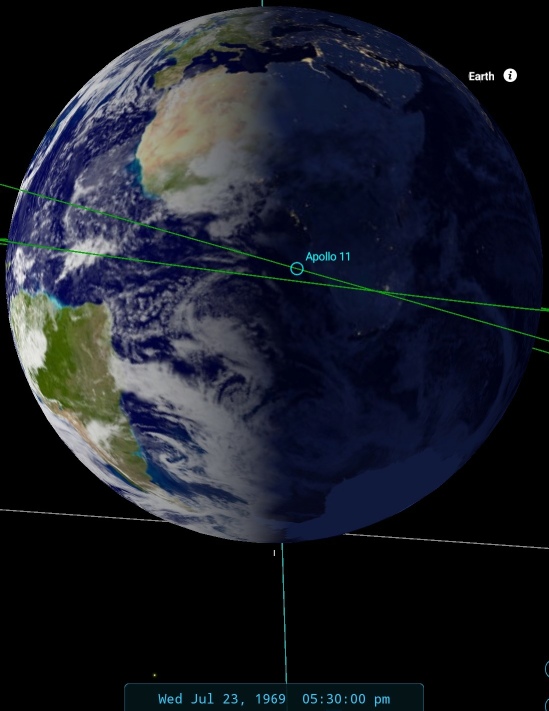
According to SkySafari, the Apollo image used is actually from the early hours of the 23rd. The ATS-
This view of Earth is also captured on video. On the way back from the moon the crew made a couple of TV broadcasts capturing their thoughts after successfully landing. One such live broadcast shown on ABC news is recorded here. The date of the broadcast is not given specifically in the clip, but the words in the mission transcript make it clear that is the one made at 155:36, or just after 01:00 GMT on July 23rd, around the same time as AS11-
At 155:51, or around 01:20, after some demonstrations of life in weightless conditions, Collins says:
155:51:23 Collins: Roger. Stand by one, and we'll get you that Earth quick.
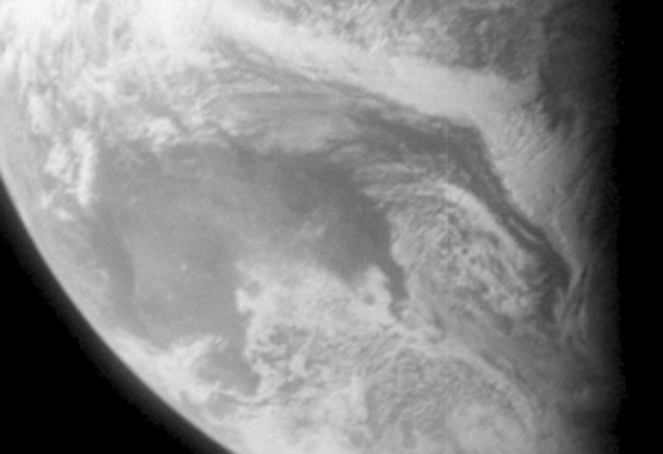
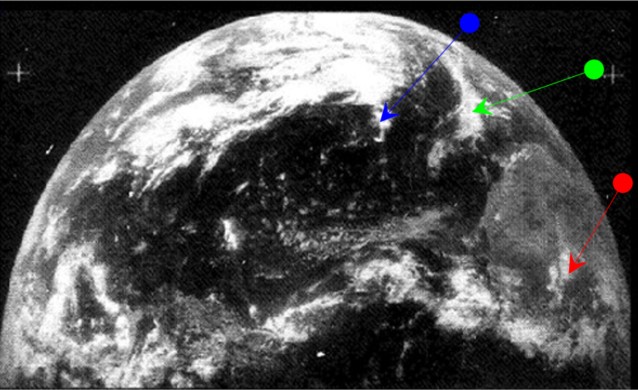
and begins a long zoom into what is initially a white blob, but ultimately ends in the screenshot shown in figure 4.3.8.5. Figure 4.3.8.6 shows that image in comparison with the ESSA & ATS images, as well as AS11-
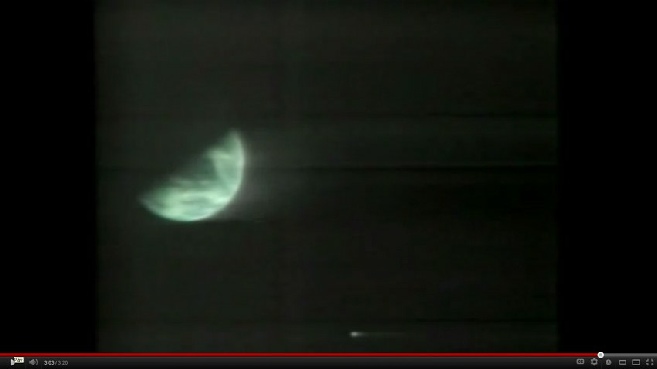
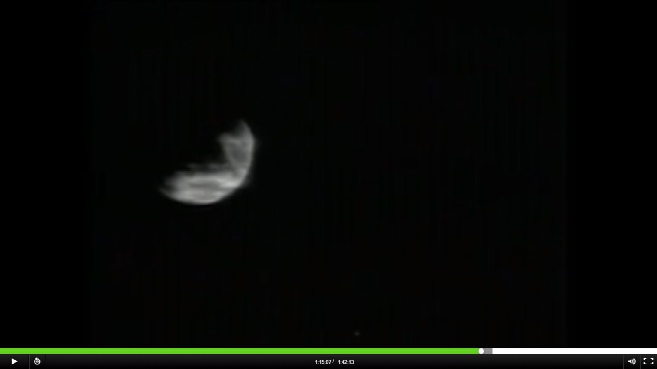
Figure 4.3.8.5: Screenshots taken towards the end of live Apollo TV broadcast, 23/07/69.
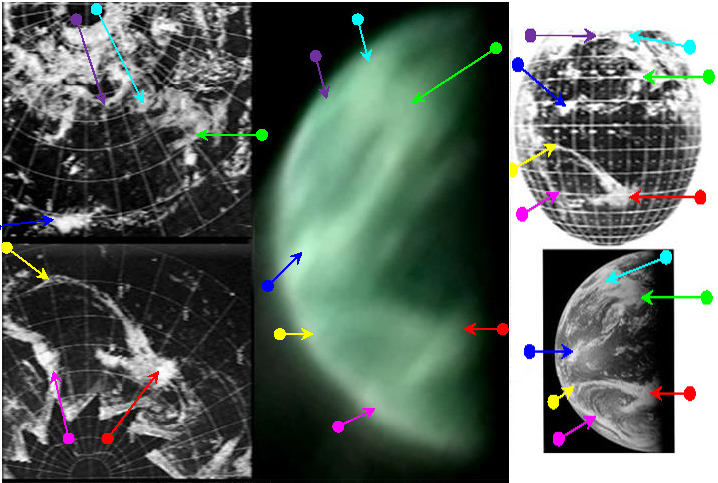
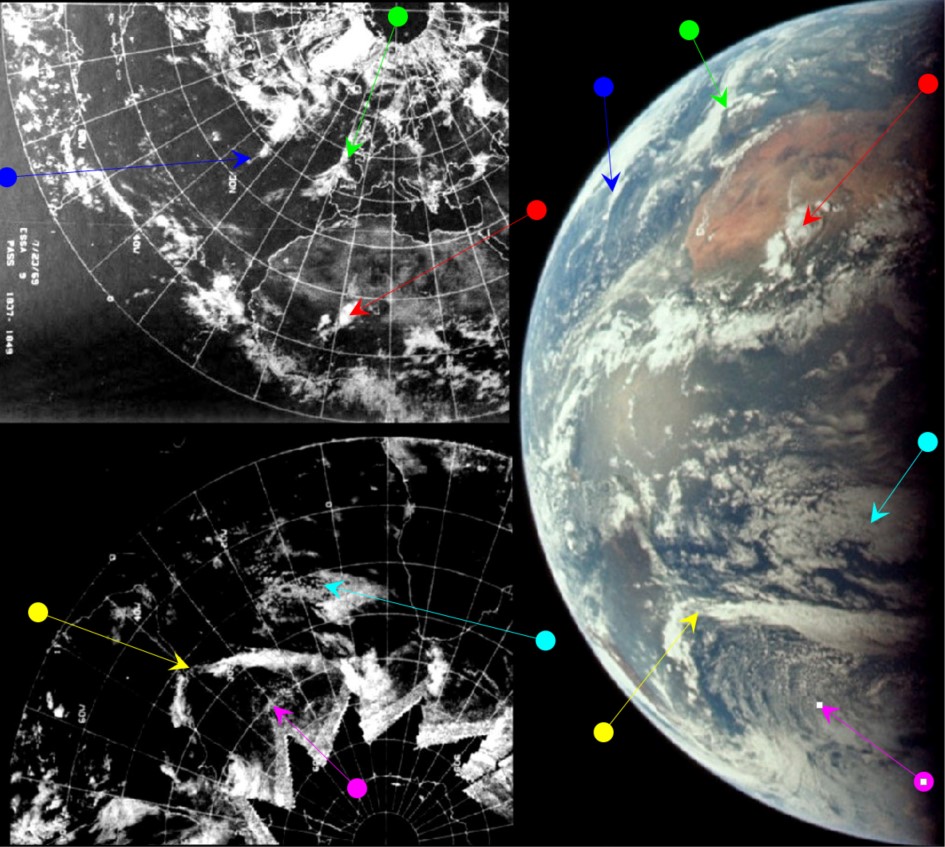
Figure 4.3.8.6: TV image from 23/07/69 compared with ESSA-
The comparison between the video still and the black & white image is obvious, particularly the large system picked out by the red arrow.
After the broadcast, at 156:12 MET into the mission, or about 01:35 on the 23rd, shortly after a TV broadcast, Collins reports that:
156:08:26 Armstrong: Rog. We were watching a few clouds in your area through the monocular along the Texas Gulf Coast this afternoon, and we also noticed there were clouds over Baja California, which is a little bit unusual.
so they were clearly positioned correctly in space to see what Stellarium says should be visible.
Returning to the Apollo rescue story, what is evident is that there were several satellites, and even eye witness reports from space, containing the information that NASA required to judge whether a landing site was safe or not. Reconnaissance flights on the day of the landing itself revealed “considerable showers” in the original landing zone, rather than the “violent thunderstorms” that the article claims they found. However as anyone who has relied on a weather forecast knows, they can be incorrect.
Can we find anything to support Brandli’s version? Certainly at this point in the mission NASA weren’t worried and advised through Capcom that:
156:10:05 Duke: …It looks pretty good as far as I can tell, We got the -
Even at about 172 hours in (around 17:35 on the 23rd), Capcom are still unperturbed:
While NASA were relaxed, other areas of the operation were evidently concerned. The navy photographer for the recovery operation reports (in Navy History) that:
“Deteriorating weather with rain, high winds and rough seas approached the Primary Recovery Area and caused much concern on July 22. The Navy and NASA decided it was best to move the splashdown site to another location 250 miles from the storm. USS Hornet steamed at full speed to the new location 950 miles southwest of Hawaii. A few of the crew wondered if we’d be late for splashdown.“
And in this Popular Mechanics article, Chuck Deiterich, retrofire officer (RETRO) for the black team at Mission Control and therefore responsible for the re-
“About 16 hours before re-
The Mission Recovery log (available for download at the Kennedy Space Centre website, membership required) shows an entry at 00:45 on the 24th:
“Suddenly there are weather problems [at the recovery site]. Forecast now says 1000 feet scattered, 2000 feet broken overcast. Many thundery showers with tops to 50000 feet! Visibility 10 nautical miles, 0.5 -
The above has been ‘translated’ from the many abbreviations used. “130” refers to Task Force 130, the naval flotilla responsible for recovery, of which USS Hornet was the lead vessel. The start of the log specifically notes that it will record weather reports and observations, so obviously they were keeping an eye on the situation regardless of any secret operations. It is interesting that the last comment says that it is 130’s forecast, rather than NASA or ESSA (in the book Space Launch Complex 10, which also recounts the story, it is mentioned that the US Navy were providing the forecasts).
The entry for 01:30 on the 24th says:
"Retro says if we move [recovery] he would want to move it no more than 80 nautical miles uprange or no less than 150 nautical miles downrange. 130 recommends approx 250 downrange for new [target point]"
And the move is confirmed in the log at 03:05, so that by 181:42 MET (c. 03:15 on the 24th) Capcom can relay the following to Apollo 11:
“the weather is clobbering in at our targeted landing point due to scattered thunderstorms. We don't want to tangle with one of those, so we are going to move the -
We also have evidence from USS Hornet herself. This Military History document records the official time of the course change as 04:04 on the 24th, giving the reason for that change as
“a forecast of marginal weather”
And later notes that
"The evening prior to splashdown...weather in the end-
USS Hornet’s own handwritten logs (available at Research Archives) also record the course change at that time.
It is entirely possible that Brandli's version of events is true, and he did find evidence of likely problems in the landing zone independently of ESSA in the military's DAPP satellite data, and went hell for leather to Captain Houston to report his findings. It certainly seems that the course change was sudden and relatively late in the day and his actions in relating that to someone who was in a good position to influence matters may well have been crucial. This has to be reconciled with ESSA’s own reports that they were seeing this by the 22nd that certainly weren’t top secret, and that Task Force 130 were producing their own forecasts (this magazine has an article stating that US Navy ships had their own receivers for satellite images).
We know from the numerous examples presented in this research that the satellite images used by NASA were of very high quality, certainly better than the one shown in figure 4.3.8.1. We know that ESSA’s satellites & personnel were closely involved in this and other missions so they must have had access to accurate forecasts. It’s also fair to say that DoD satellites had a more sophisticated array of specialist sensors, even if the overall image quality was comparable it could measure things more precisely and used more parameters to aid forecasting. Figure 4.3.8.7 shows an example from 1971 of the kind of quality available. Whether they’re of comparable, or better quality compared with the ESSA and NIMBUS views is debatable without actual first hand source material, but they are undeniably very good.
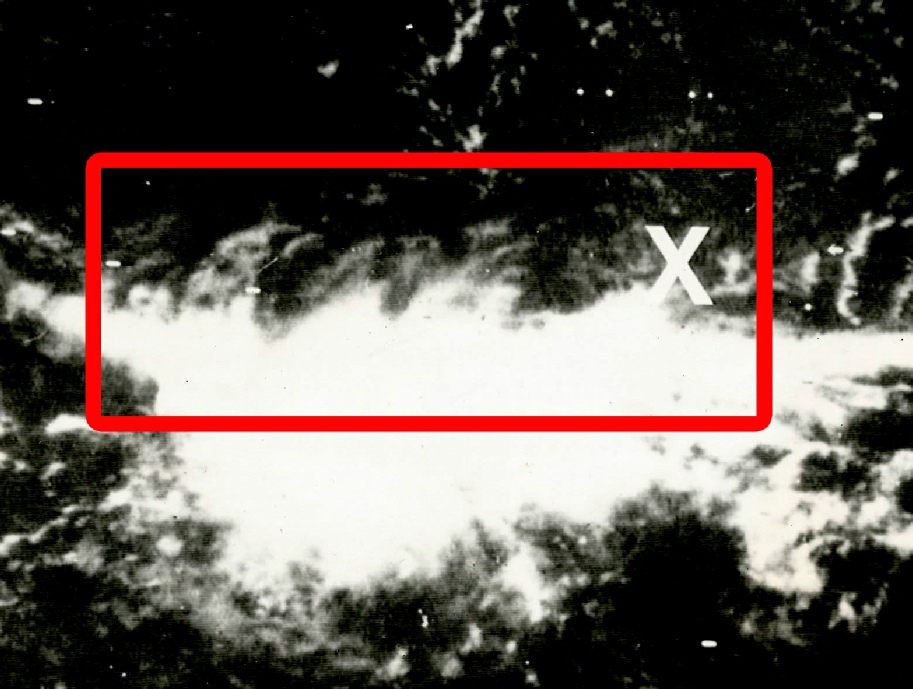
Figure 4.3.8.8: Cloud formation around the original landing area for Apollo 11 (marked with an X) from a NIMBUS image dated 22/07/69
If that is the case it further complicates the story, as this photograph is one publicly released to the media!
Whatever the truth of the matter, Apollo’s eventual landing zone was altered, Captain Houston was credited with saving their lives, and the shifting weather patterns are recorded in Apollo’s images.
We digress – there is still some time to go before recovery, and there are more photographs to analyse, An example of this detail occurs next in the narrative.
Another weather system around on the 22nd, one that is mentioned on several occasions in the mission transcripts, is Tropical Storm Claudia. Claudia was a short lived storm that formed off Hawaii on July 21st and was dying away by July 23rd. It was reported in several journals, including the monthly weather review: MWR . It is also mentioned in the Mariner's weather log in September 1969 (MWL). Claudia was hidden by darkness in the photographs from the 21st and 22nd, but should be visible as a remnant on the 23rd in AS11-
Figure 4.3.8.9 shows Claudia as seen from ESSA 8 on the 21st (from the MWR), ESSA-
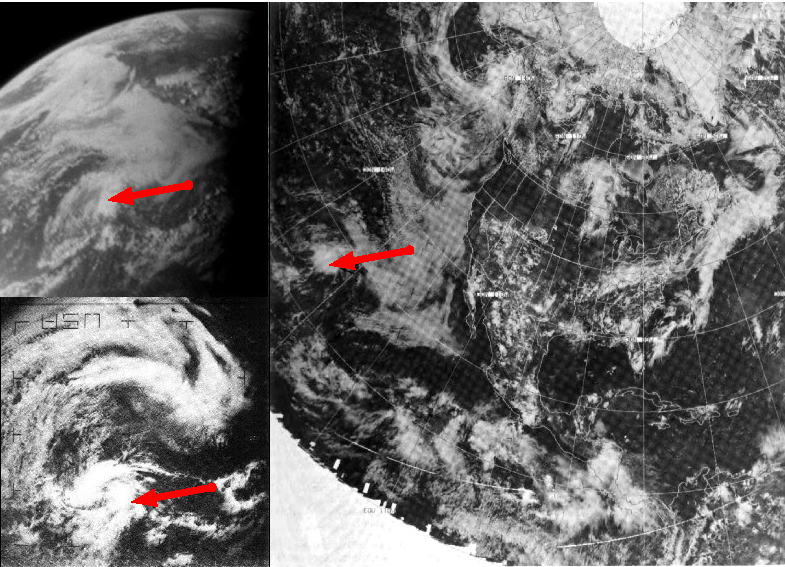
Figure 4.3.8.9: Tropical storm Claudia on the 21st (bottom left), 22nd (right) and the early hours of the 23rd (top left). Sources identified in the text.
For the next image we have a return to a view of Australia, this time from Magazine 38.
AS11-
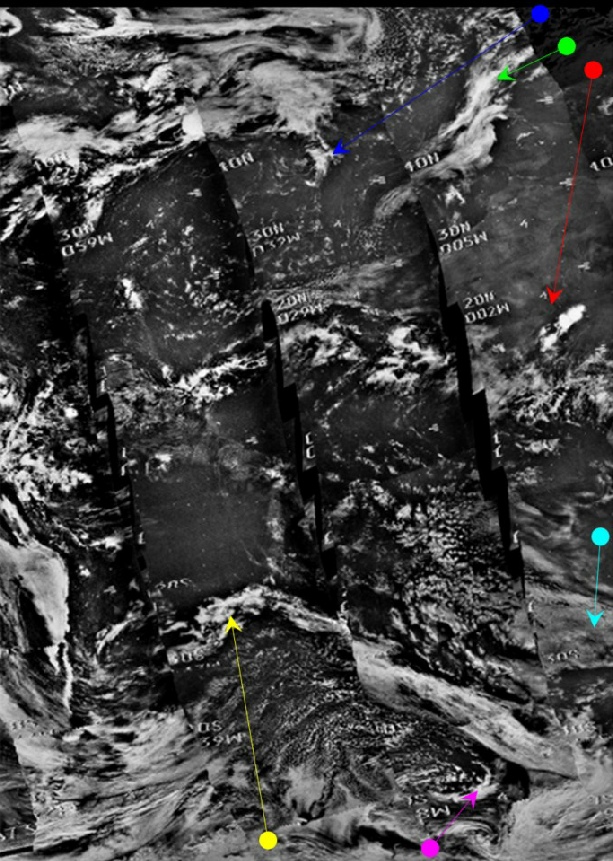
Figure 4.3.8.10: AS11-
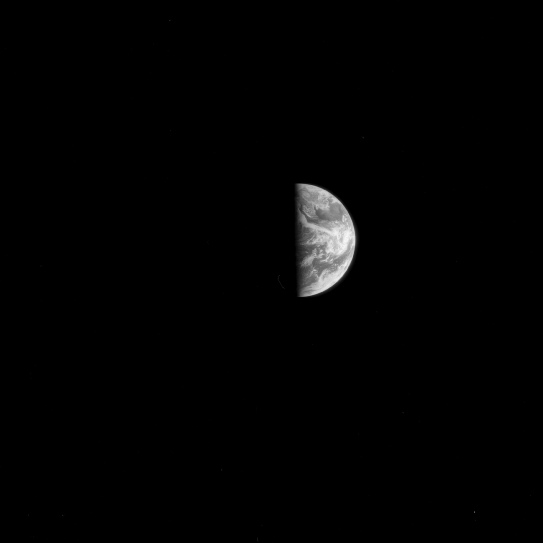
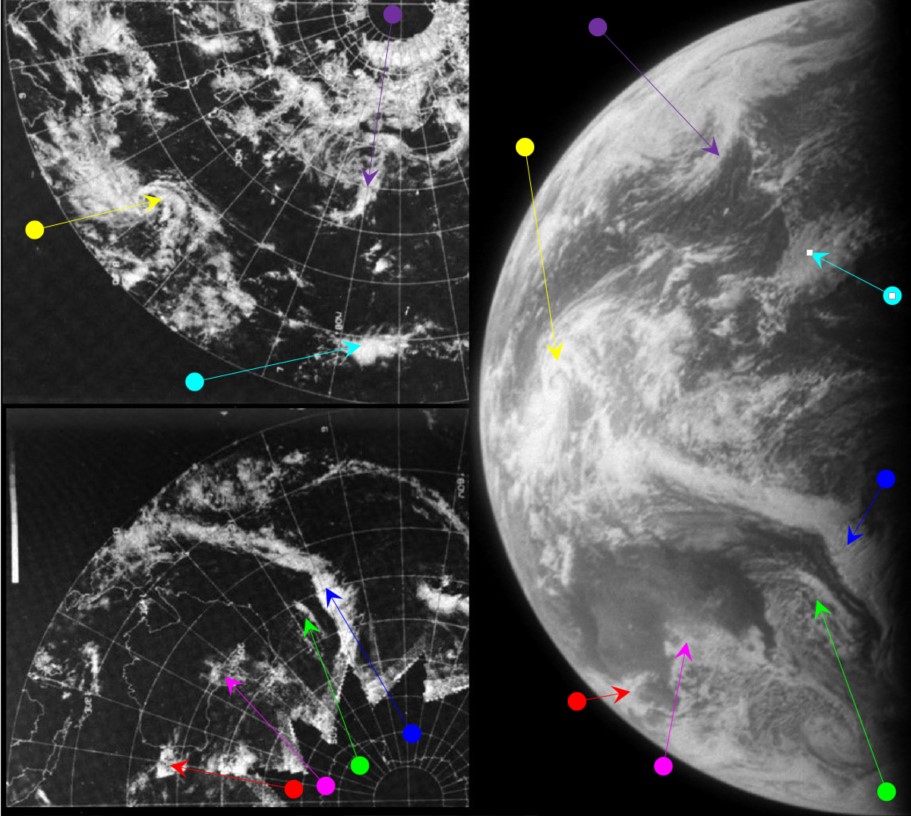
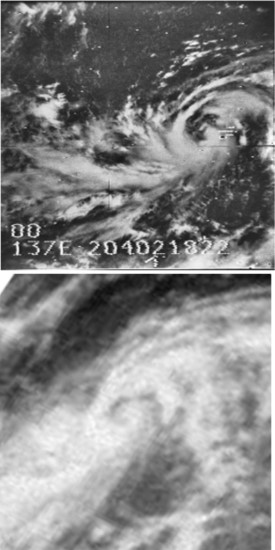
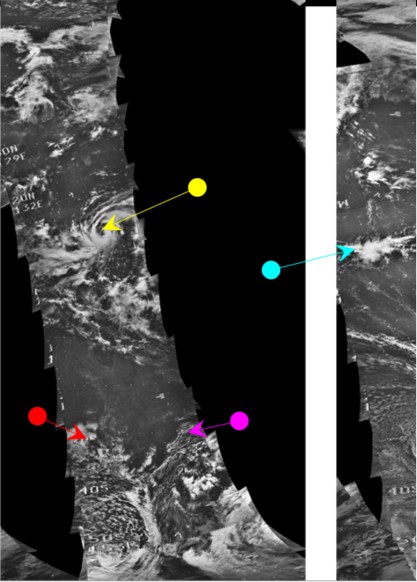
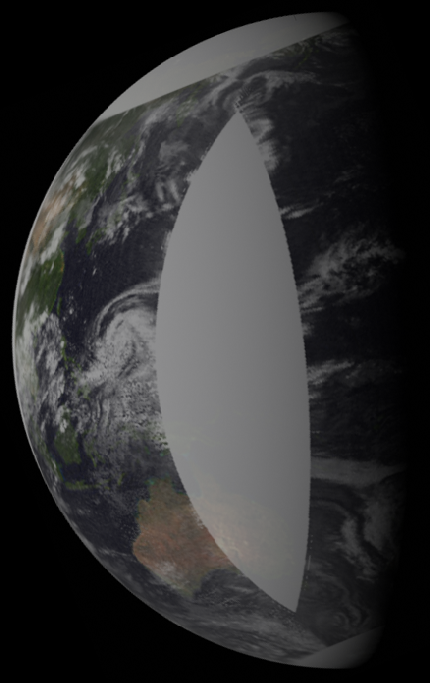
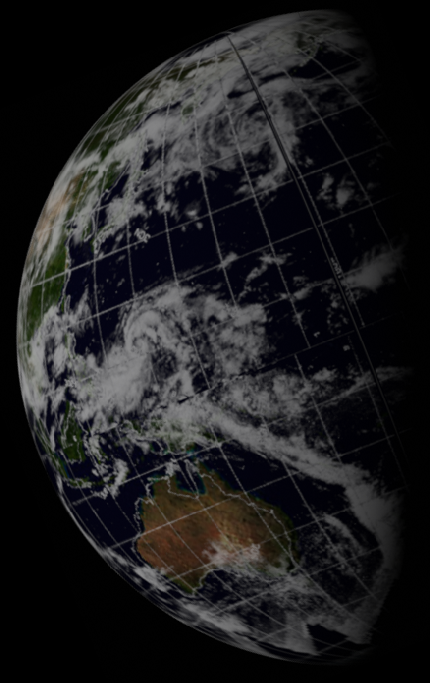
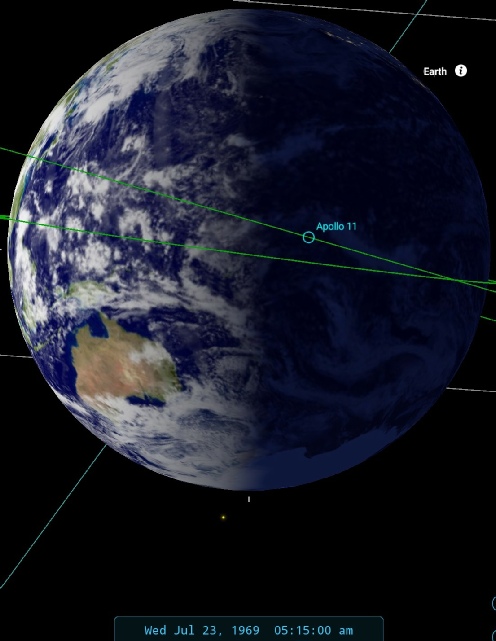
Figure 4.3.8.11: ESSA-
There are some features on this image that can also be found in the previous one, but they are mostly unidentified to allow for new features to be picked out. The blue arrow in figure 4.3.8.6 shows the same arrow as the cyan arrow in this one. The purple and yellow arrows in figure 4.3.8.6 show systems that are still (just) visible in figure 4.3.8.11. It's interesting to note that the weather systems that were so prominent around Australia on the days around the landing have largely disintegrated and are much less coherent than before. The storm picked out by the yellow arrow is shown in (level adjusted) detail with the corresponding NIMBUS tile just because it is undeniably there! The storm’s location is consistent with the track of Tropical Storm Viola, as shown here.
SkySafari estimates a time for this image as around 05:15 on the 23rd, derived largely from the position of Australia. ESSA's terminator orbit (track 6, pass 1832) commenced at 00:05 on the 23rd.The NIMBUS terminator pass (or at least the first one with any data) is orbit 1338, which commenced at 01:57 on the 23rd.
After taking this quick Earth sequence, the crew turn their attention back towards the moon, before returning to Earth for another quick snapshot of home. In that short interval, the Earth has managed to rotate -
Figure 4.3.8.13: Left, AS11-
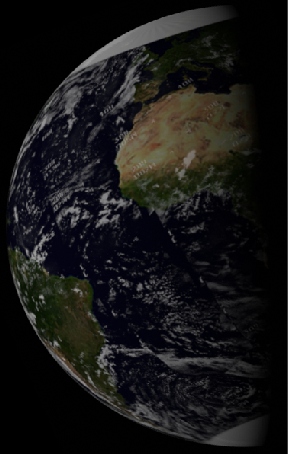

SkySafari estimates a time of this image as around 17:30 on the 23rd, and it is beginning to be more noticeable that the Earth is moving towards a crescent shape as time passes. The colour image hardly differs from the black and white version, although the different angle of the Earth (caused by the PTC roll) suggests that there is a small time gap, it is difficult to pick out anything along the terminator that would indicate how much.
Not long after this image was taken we have a comment from the ground:
171:53:47 Garriott: 11, Houston. Present forecast shows acceptable conditions in your recovery area -
This is, again, confirmation that NASA were using their own satellite images to monitor closely weather conditions likely to affect the landing area, and also that the landing zone had moved.
As far as the satellites they’re using are concerned, the ATS image is timed at 15:17 on the 23rd. ESSA-
The next image taken of Earth is AS11-
Figure 4.3.8.14: ESSA-
Figure 4.3.8.15: AS11-
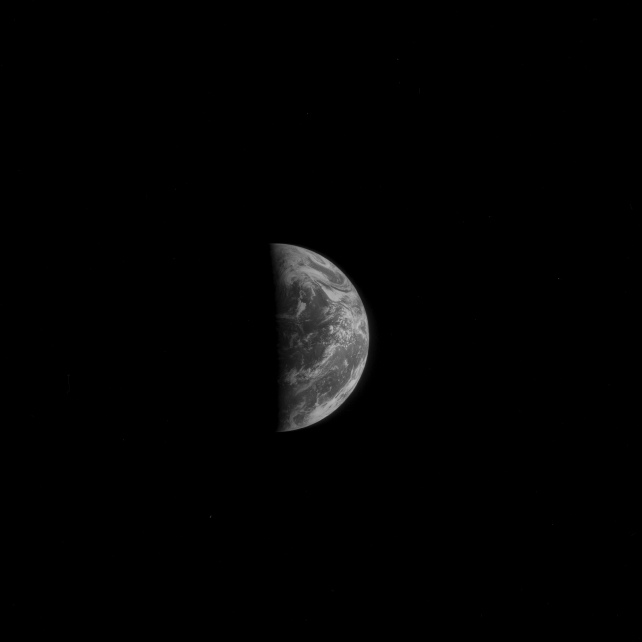
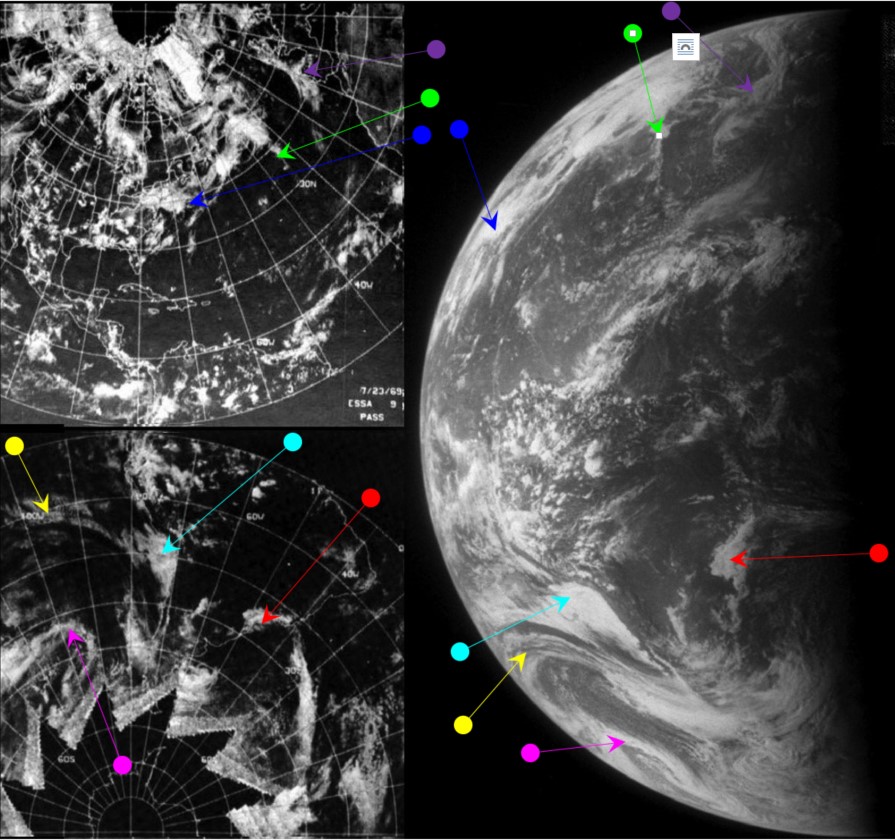
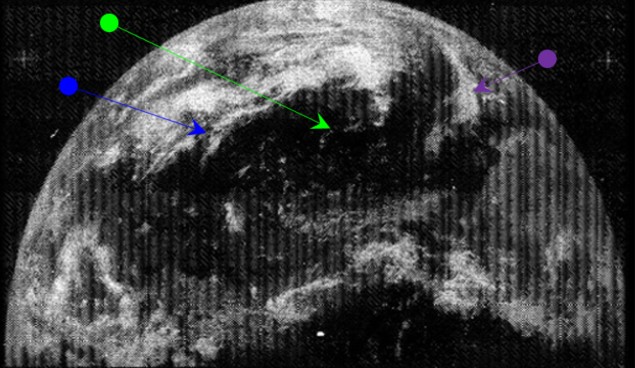
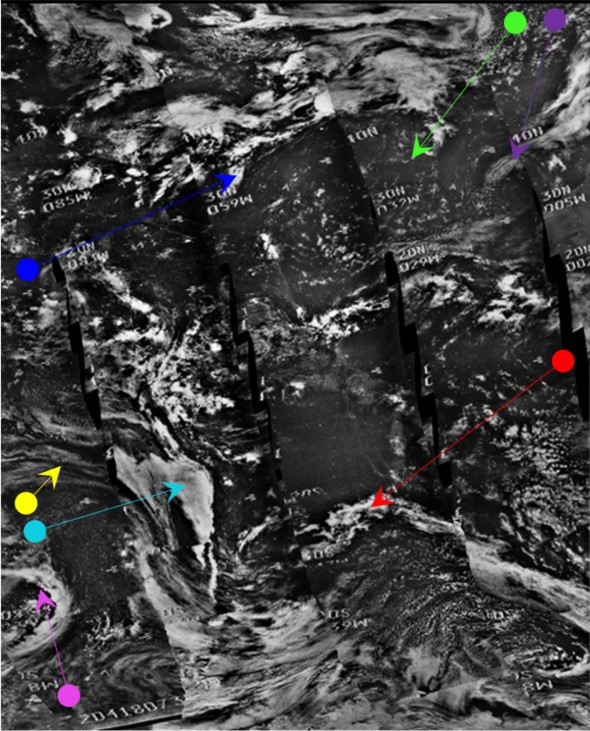
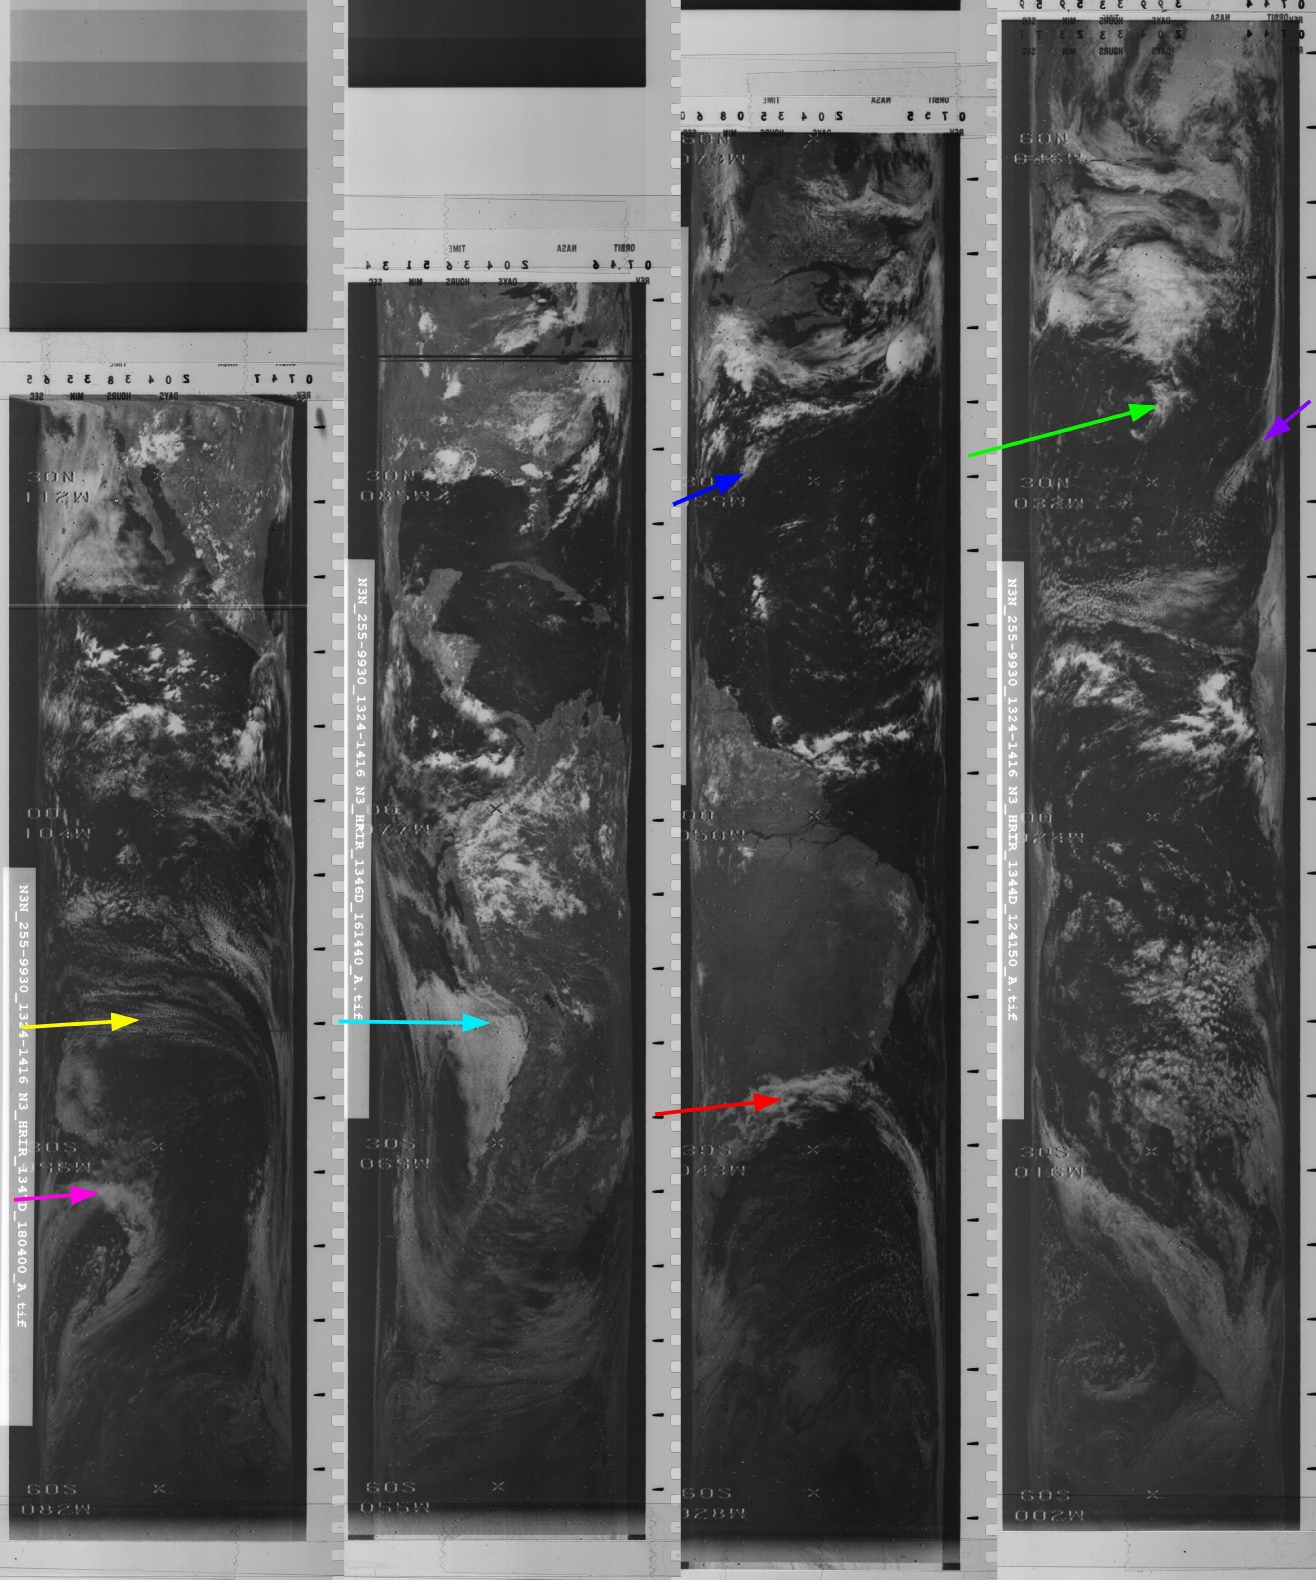
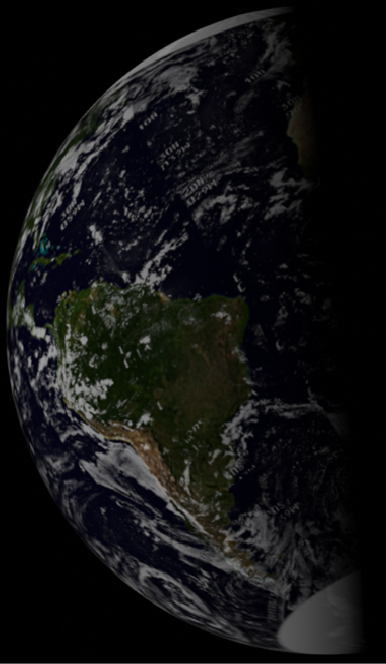

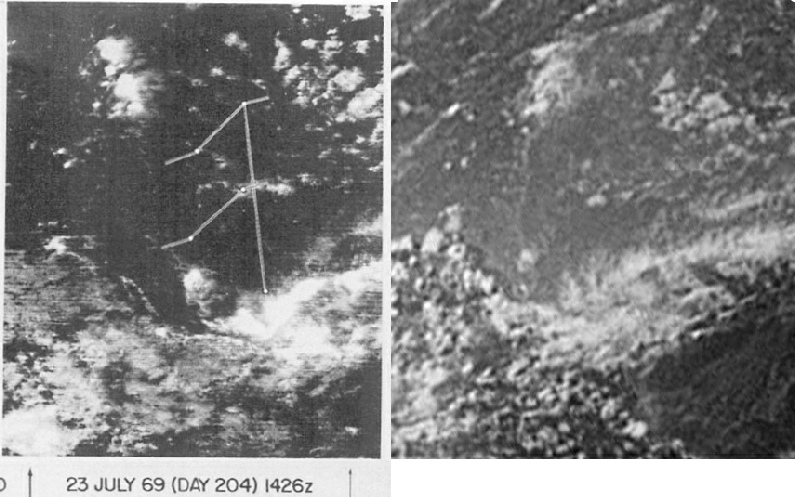
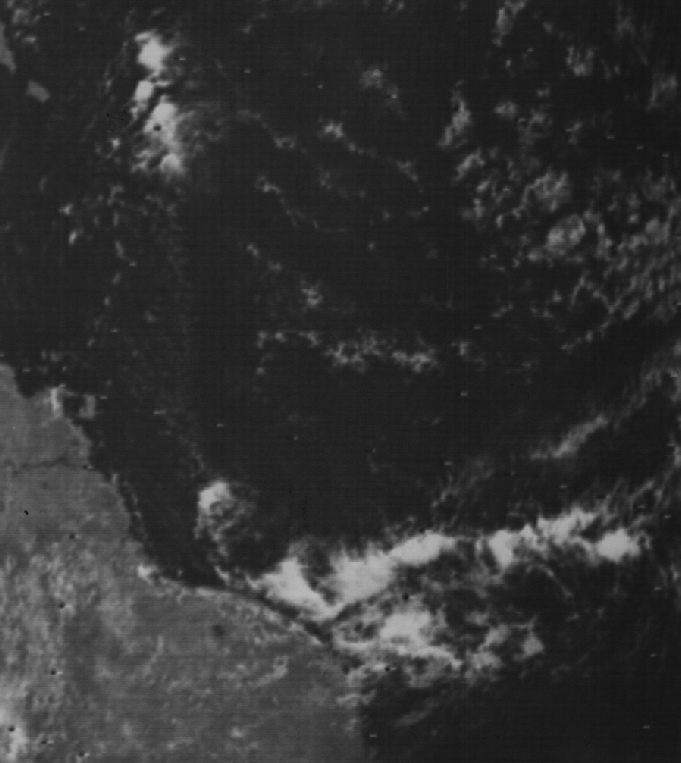
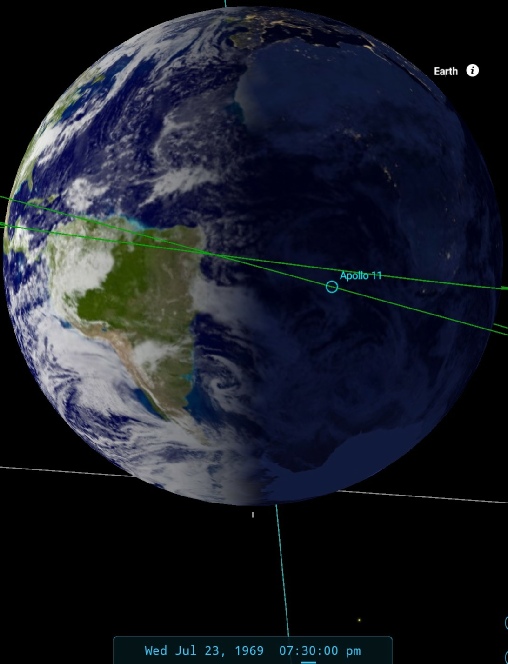
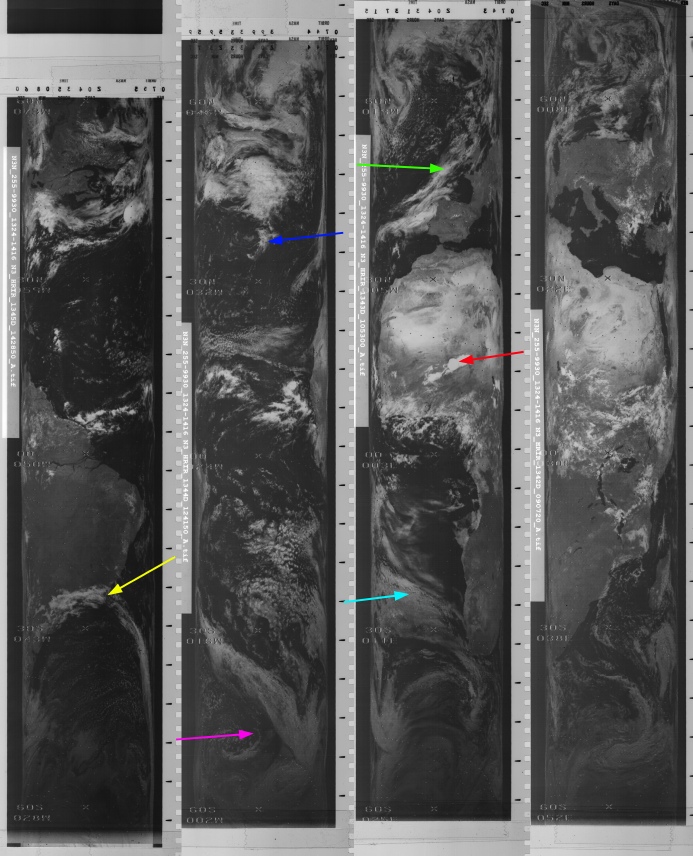
Figure 4.3.8.16: Row 1: ESSA-
Row 2: ATS-
Row 3: NIMBUS-
Row 4: NIMBUS-
Row 5: 3D reconstructions of ESSA and NIMBUS data, and SkySafary time estimate
Row 6: Close ups of ATS 3 images from the BOMEX report
SkySafari puts the Apollo image as being taken at 19:30. Despite this being 5 hours after the ATS-
As far as the satellite timings are concerned, ATS-
Before we move on to the next photograph there’s one very dark image we can try and decipher. Figure 4.3.8.17 shows AS11-
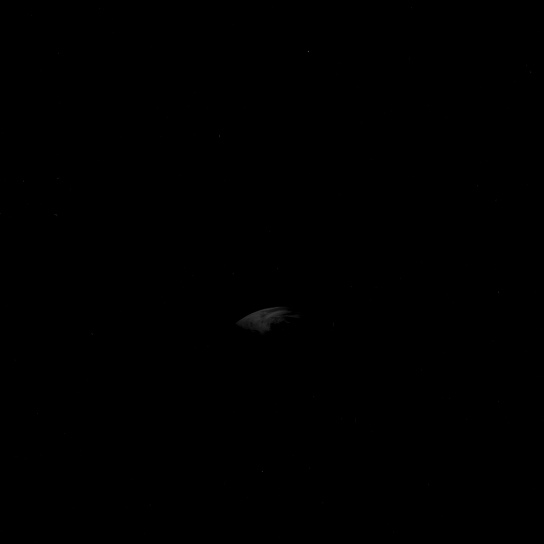
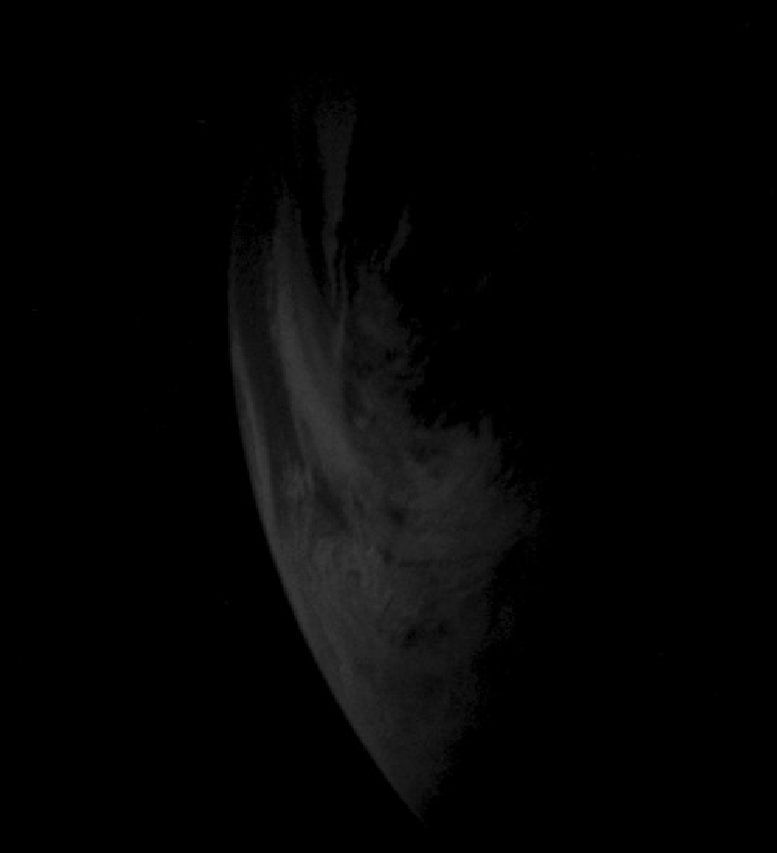
Figure 4.3.8.17: AS11-
OK so it’s a piece of Earth, but which bit. Luckily the photo we’ve just analysed can help us out. Figure 4.3.8.18 compares the two.
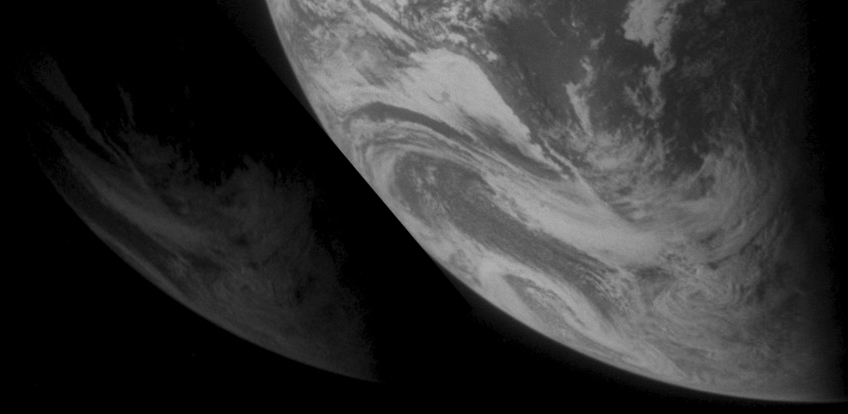
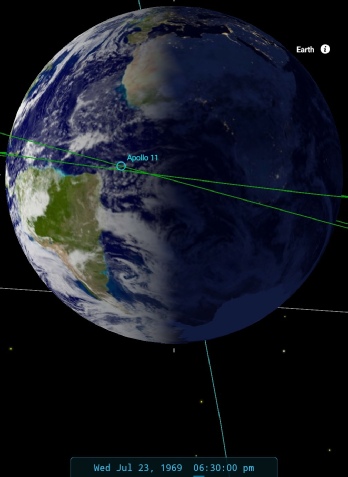
Figure 4.3.8.18: AS11-
Once you look at the much brighter, later picture it’s easy enough to see that we’re looking at the coast of Chile, and that it was taken roughly an hour before the brighter one,
The next image moves the clock on a little further, as can be seen in figure 4.3.8.19, but not enough to make it worth going to town on.
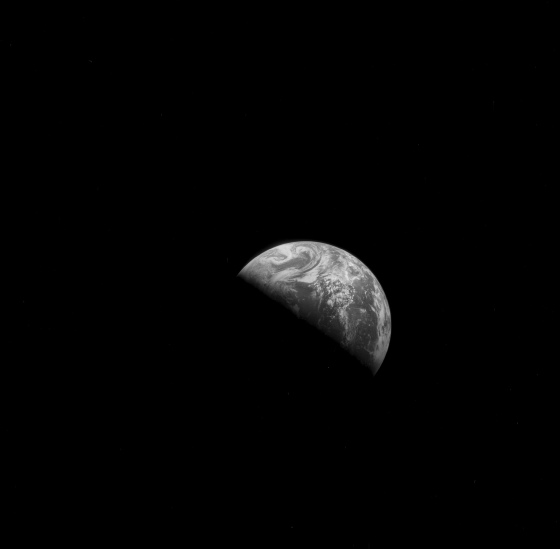
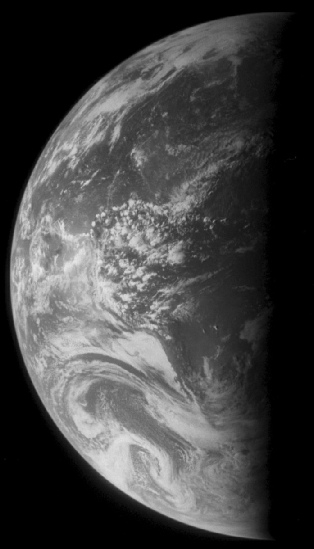
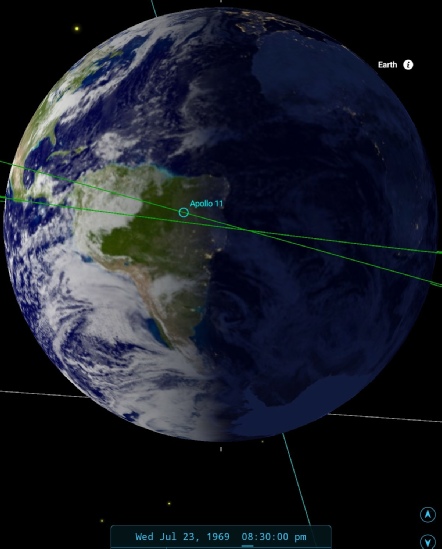
Figure 4.3.8.19: AS11-
The eastern edge of Brazil is now disappearing into darkness, which allows us to set the time at around 20:30.
The next image up for a full analysis is AS11-
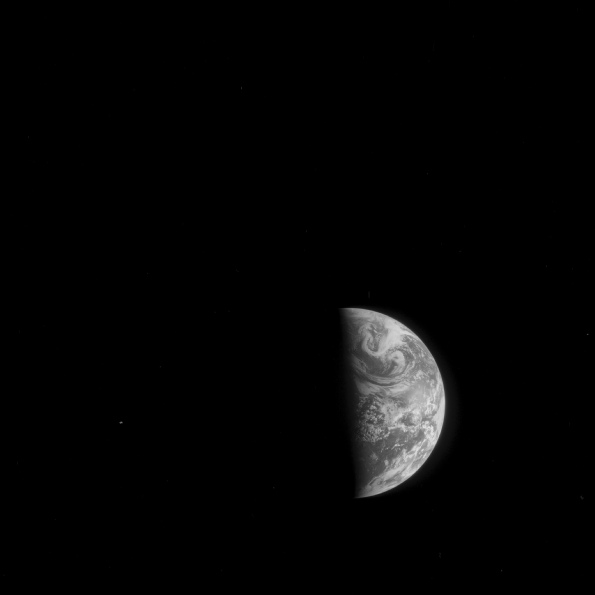
Figure 4.3.8.20: AS11-
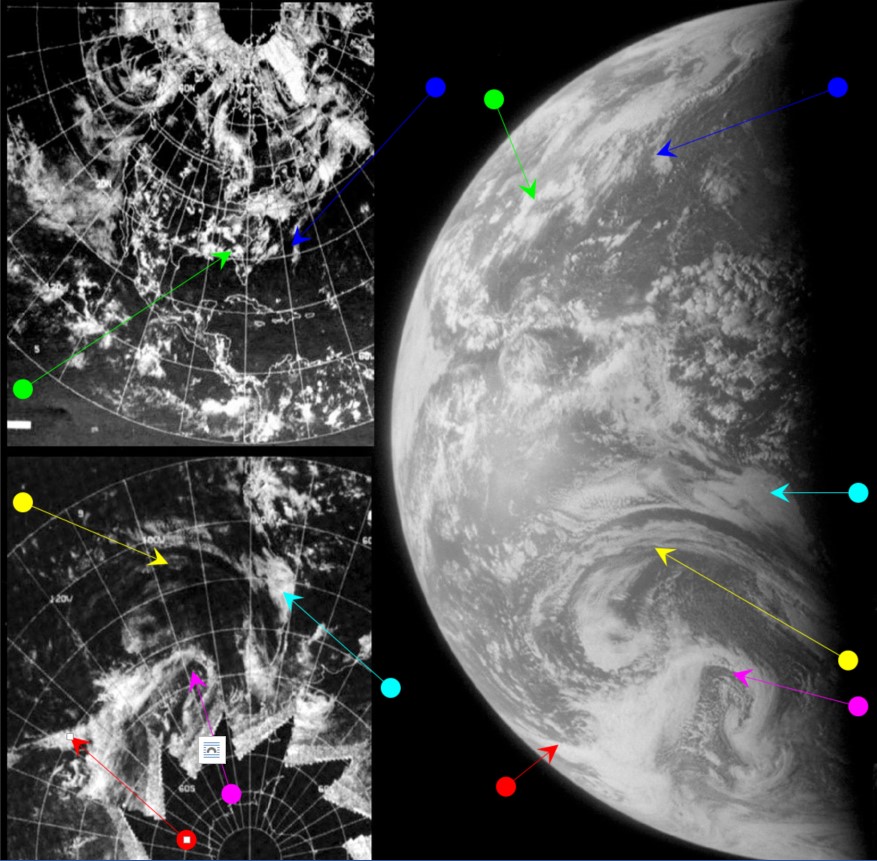
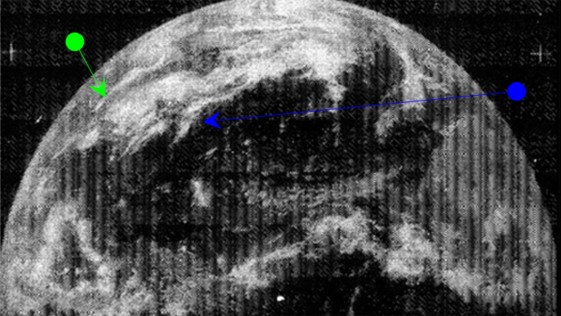
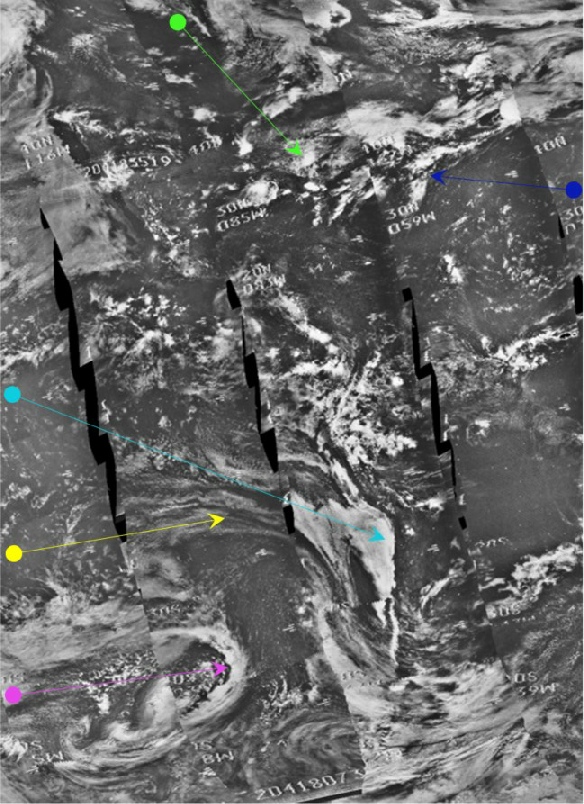
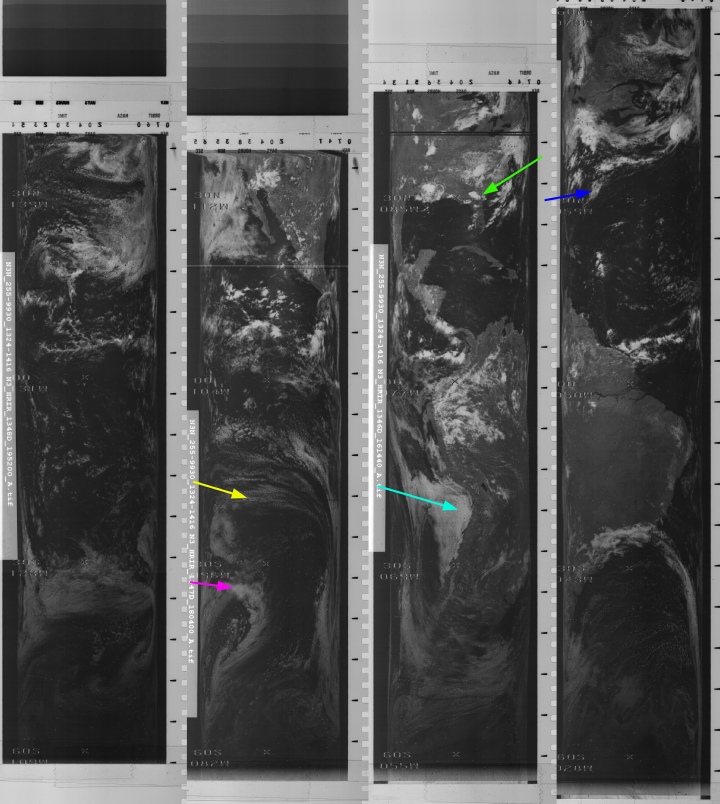
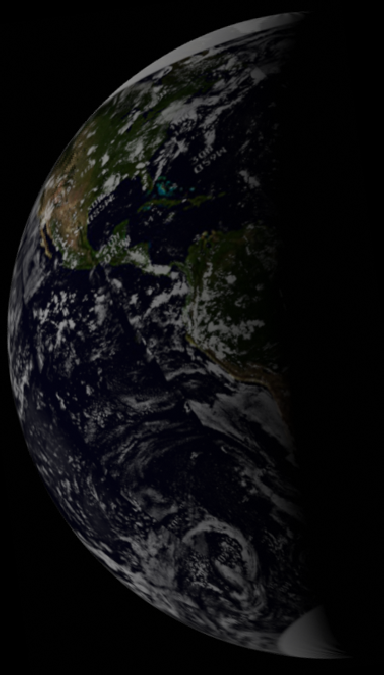

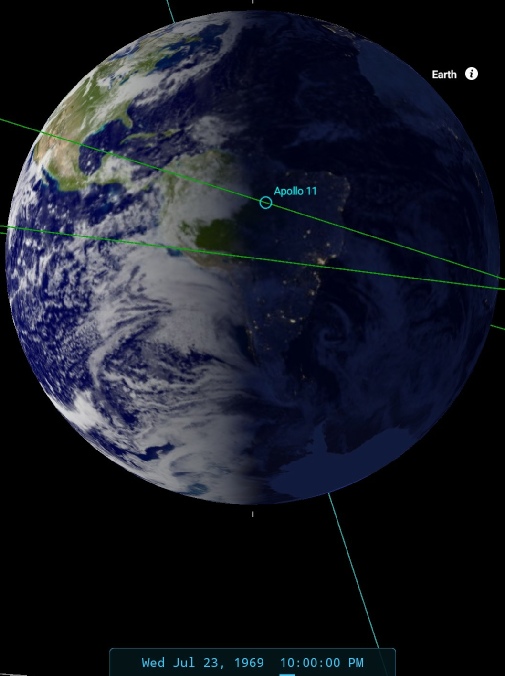
Figure 4.3.8.21: ESSA-
In this photograph, there has been sufficient rotation of the Earth to allow the spectacular weather system off western south America to come more clearly into view, but not sufficient to completely remove some of the cloud patterns visible in the previous analysis. The cyan, yellow, magenta and blue arrows all point to features visible in figure 4.3.8.16.
SkySafari puts the time of the photograph as around 22:00. The time of the ATS image is, as usual unchanged. ESSA's orbital pass over the terminator is number 1840 (track 2), which commenced at 16:07 on the 23rd. The NIMBUS pass for the same region is 1345, which commenced at 14:28 on the 23rd.
We also have another live TV broadcast on the 23rd with views of Earth to look at, where the crew gave their thoughts and impressions of their achievement to the folks back home. Towards the end of that broadcast they turned the camera towards that home to give us an upside down view of Earth That view is shown in figure 4.3.8.22 together with a dated press screenshot and a newspaper front page dated the following day, and analysed in figure 4.3.8.23.
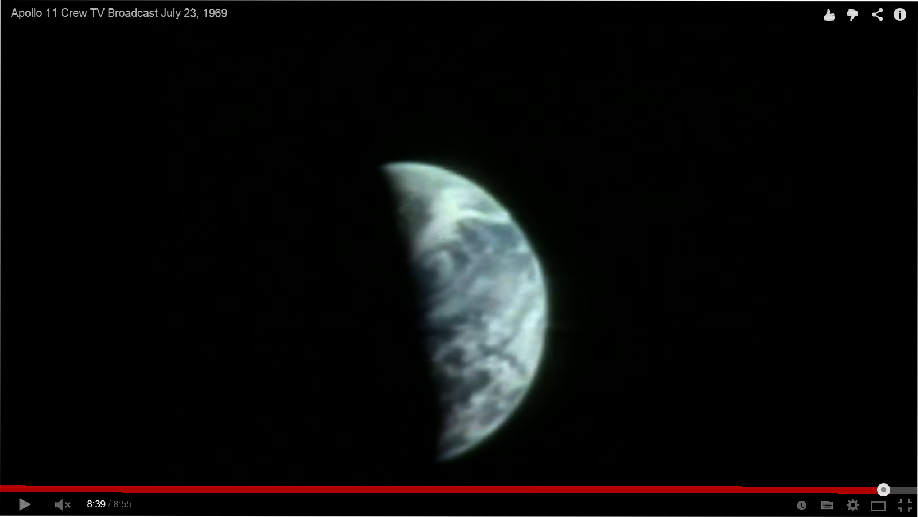
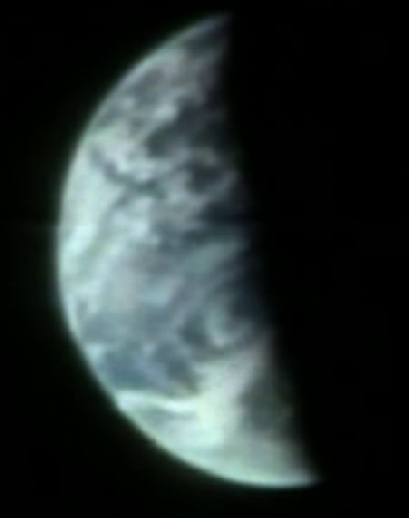
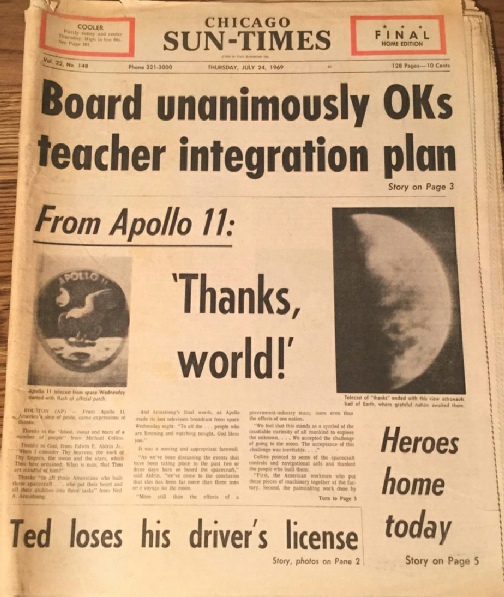
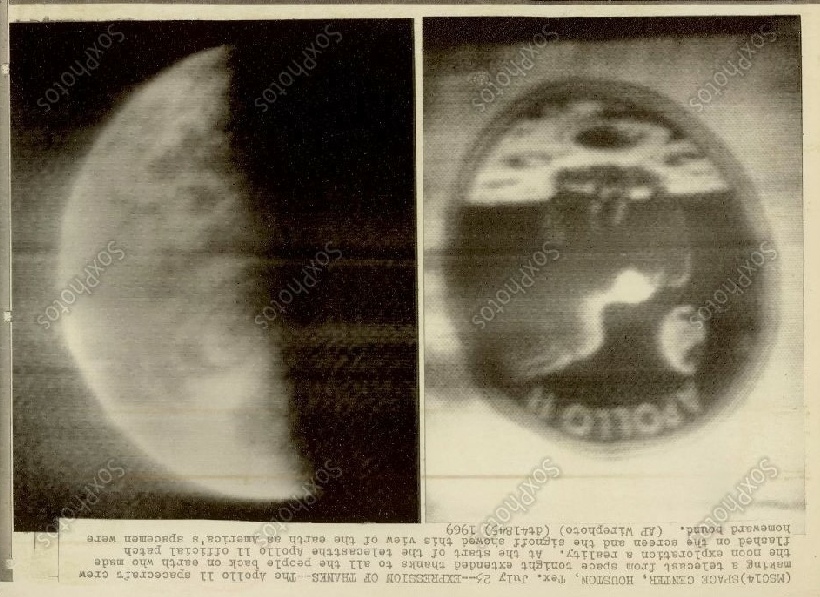
Figure 4.3.8.22: Screenshot from this youtube footage of Apollo 11 TV Broadcast 23/07/69 (with close up), a dated press photo taken from the broadcast, and a newspaper front page for sale on eBay dated 24/07/69
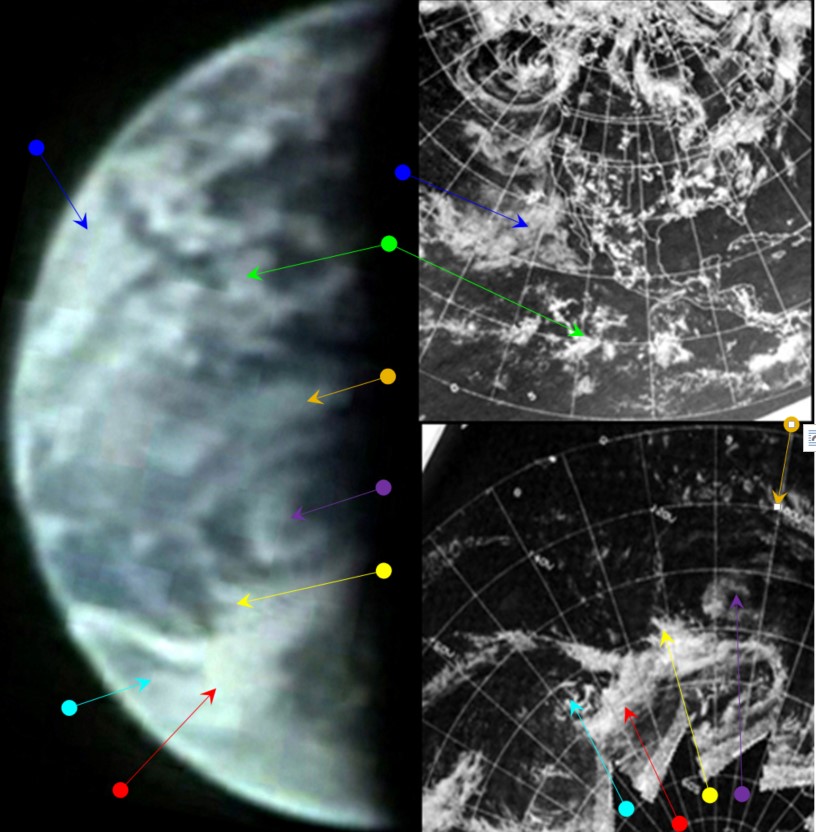
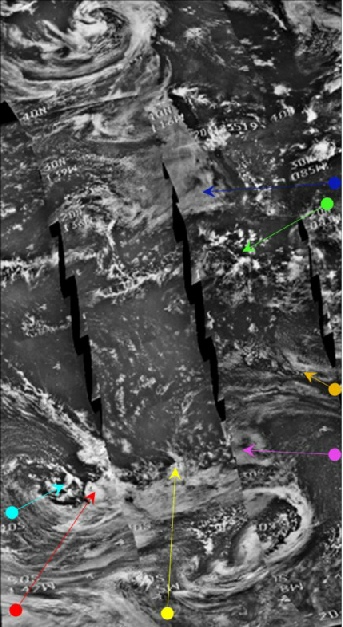
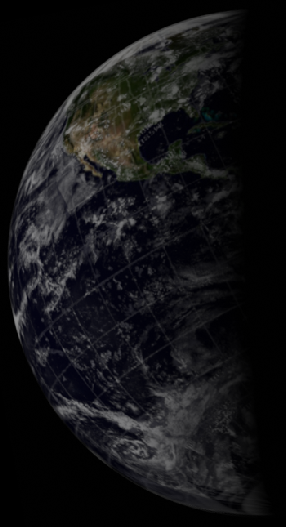
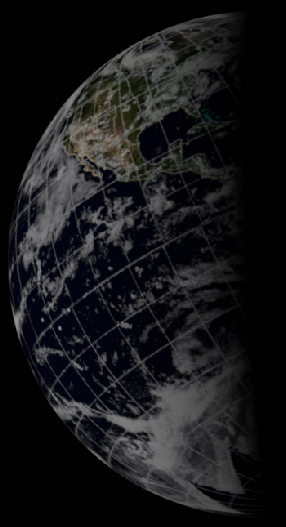
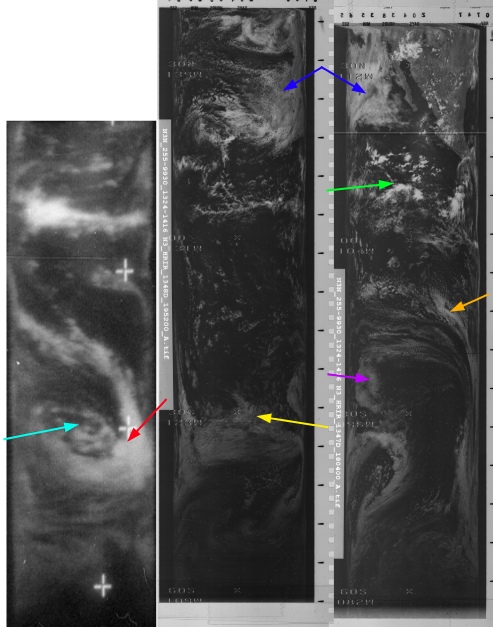
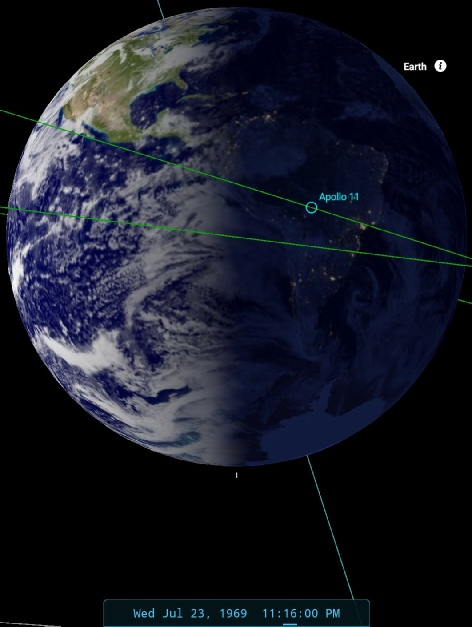
Figure 4.3.8.23: Main image -
As far as timing goes we can be pretty exact about the Apollo image. The TV broadcast is recorded as being made between 23:04 and 23:16 on July 23rd. At 23:15 we have a comment from Houston as the camera focuses on Earth:
177:43:52: 11, this is Houston. We're getting a zoom view out the window now.
SkySafari shows that North America would not be completely in view, but you would have the west coast of the USA and Mexico in daylight. The part of South America just visible in the preceding analysis is almost entirely gone in the 75 minutes or so that have elapsed since it was taken.
The satellite view confirms that this is indeed what we are seeing, even if the land masses themselves are not entirely clear.
The main feature in the northern hemisphere are the fog banks off California (blue arrow) that extend all the way to the western limb. Moving into the southern hemisphere we have a striking swirl off south America (purple arrow), and then the striking system identified by the red arrow that was not quite fully in view in the preceding analysis.
The scene is entirely consistent with the amount of rotation that would be expected over this time period, in terms of the position of the terminator and the change in weather patterns visible. It’s worth pointing out that even the medium resolution infra-
ESSA’s terminator pass would be roughly track 4 (orbit 1842), which commenced at 19:07 on the 23rd, whereas the NIMBUS pass (around number 1346) commenced at 14:28.
The next image of Earth is a return to the colour magazine, and we cross the midnight hour to day and splashdown.
There are areas in the image shown in 4.3.8.1 that have broad similarities with ESSA & Apollo photographs, but others where there are clear differences. It is possible that the chosen DAPP image is one that was available, rather than the actual one presented by Brandli. There are also many areas where the two stories contradict each other. The 'Screaming Eagles' image is difficult to reconcile with those taken by ESSA & ATS-
For example where are the cloud and fog banks off Baja California and California that have been a persistent feature over the mission? It is possible that cloud bands picked out by the yellow arrow in the southern Hemisphere and the blue arrow in the north are those either side of the image label “Cu Streets” in figure 4.3.8.1, but the type of cloud is completely different, and the 'screaming eagles' don't seem to be there at all.
Maybe Brandli's story is correct and ESSA's is just a cover, but it is a cover that has the benefit of using many well publicised 'free to air' satellites and a team of meteorologists actually based with NASA and that was published months, rather than decades, after the landings. Houston’s Navy Commendation citation is certainly genuine, and specifically cites his role in diverting the rescue fleet.
We also know that the military had well documented involvement in weather forecasting, eg see here. Patrick Air Force Base had their own newsletter, “The Missileer”, and just before Apollo 11 this edition detailed the convening of the support group, including a Lieutenant Colonel RH Dowd as being the liaison for weather. He also gets a mention in this Air Force newsletter as part of Detachment 11, the specific part of the Air Force assisting Apollo’s weather forecasting needs. There is also the well known antipathy between military and civilian outfits to consider.
Interestingly, this edition discusses the role of the NIMBUS satellites in mission support in SE Asia, while this one details Apollo 9’s support role by the Department Of Defense -
We also have slightly contradictory testimony from Scott Carmichael’s book “Moon men return: USS Hornet and the Recovery of the Apollo 11 Astronauts”:
"Hornet occasionally sent aircraft aloft to check weather conditions within her immediate operating area, but she had no means to collect weather data beyond the limited range of such flights. Conditions which developed far over the horizon were hidden from view. And commercial weather satellite systems simply did not exist in 1969. So it was impossible for Hornet to predict weather conditions days in advance of the splashdown."
This is obviously not quite correct -
A likely scenario would be that Brandli, working at the same air force base (Hickam Field) that provided recovery and weather reconnaissance aircraft for Task force 130, sees the images and data and uses his expertise to produce a forecast that threatens the mission. He then contacts an officer with direct links to the SMG -
“Hornet relayed the on-
Which shows pretty much everyone was saying “hang on guys…”
The story they release is technically accurate in that ESSA changed the landing area thanks to a new forecast, but the detail revealing the role of a classified military satellite in the process was omitted. Brandli has also written elsewhere on the Data Acquisition and Processing Program and its results, which used military polar orbital satellites, eg Air Power and MWR and is clearly knowledgeable on the subject, with these articles appearing after the initial declassification in 1973. The claim made in some articles that DMSP satellites could provide a 5 day forecast is more likely to be due to his abilities as a forecaster than the satellite’s own properties. It’s also notable, and perhaps unfair, that he was not given the same recognition as Captain Houston.
It's unlikely that the image used in many articles showing the 'Screaming Eagles' is the one used by Brandli (he may even have coined the term!). Even the mosaic ESSA images are of comparable quality, and the zoomed in images from ESSA & NIMBUS used here are extremely clear and detailed.
It is possible that the eagles in question are the cloud formations, resembling waves, surrounded by the red box in this NIMBUS image (figure 4.3.8.8).
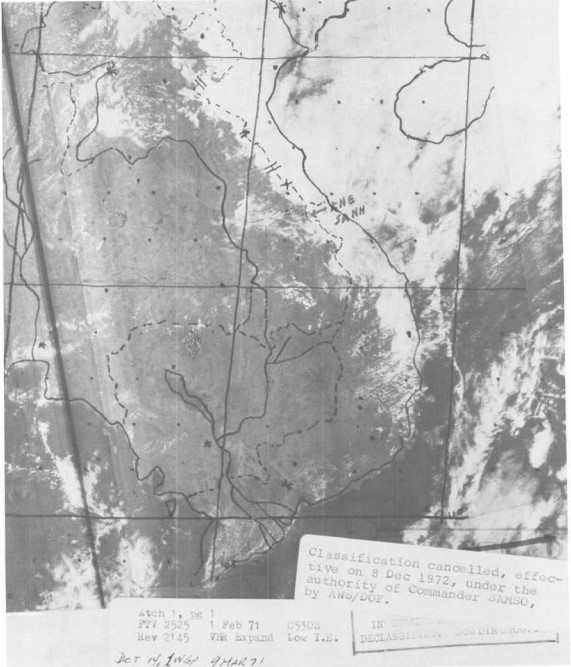
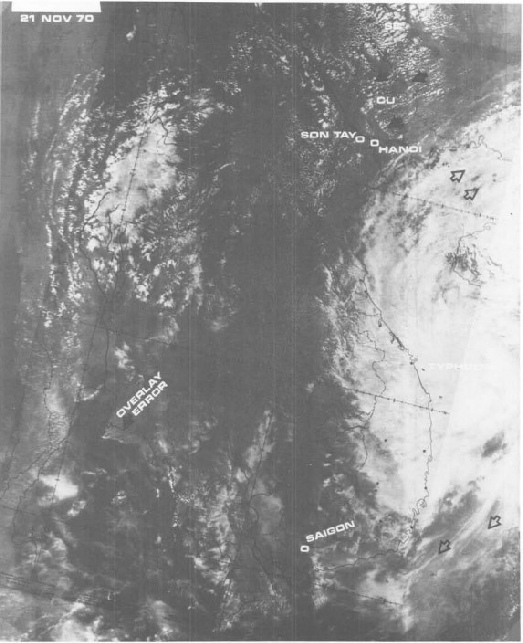
Figure 4.3.8.7: DMSP images from 1971. Source


Australia has moved across the face of the disk, and the weather system off its east coast has moved further on past the terminator, suggesting around 15 minute time lapse.
The next set of images of Earth consist of another pair taken with different cameras, one from magazine 38 and one from the colour magazine 44.
By way of variety, the colour image, AS11-
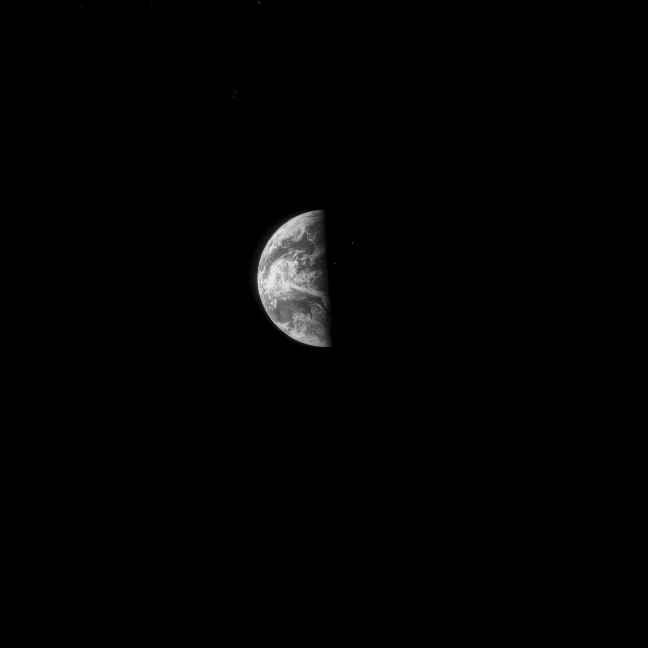
Figure 4.3.8.12: AS11-